

Overview
Bifrost includes built-in observability, a powerful feature that automatically captures and stores detailed information about every AI request and response that flows through your system. This provides structured, searchable data with real-time monitoring capabilities, making it easy to debug issues, analyze performance patterns, and understand your AI application’s behavior at scale. All LLM interactions are captured with comprehensive metadata including inputs, outputs, tokens, costs, and latency. The logging plugin operates asynchronously with zero impact on request latency.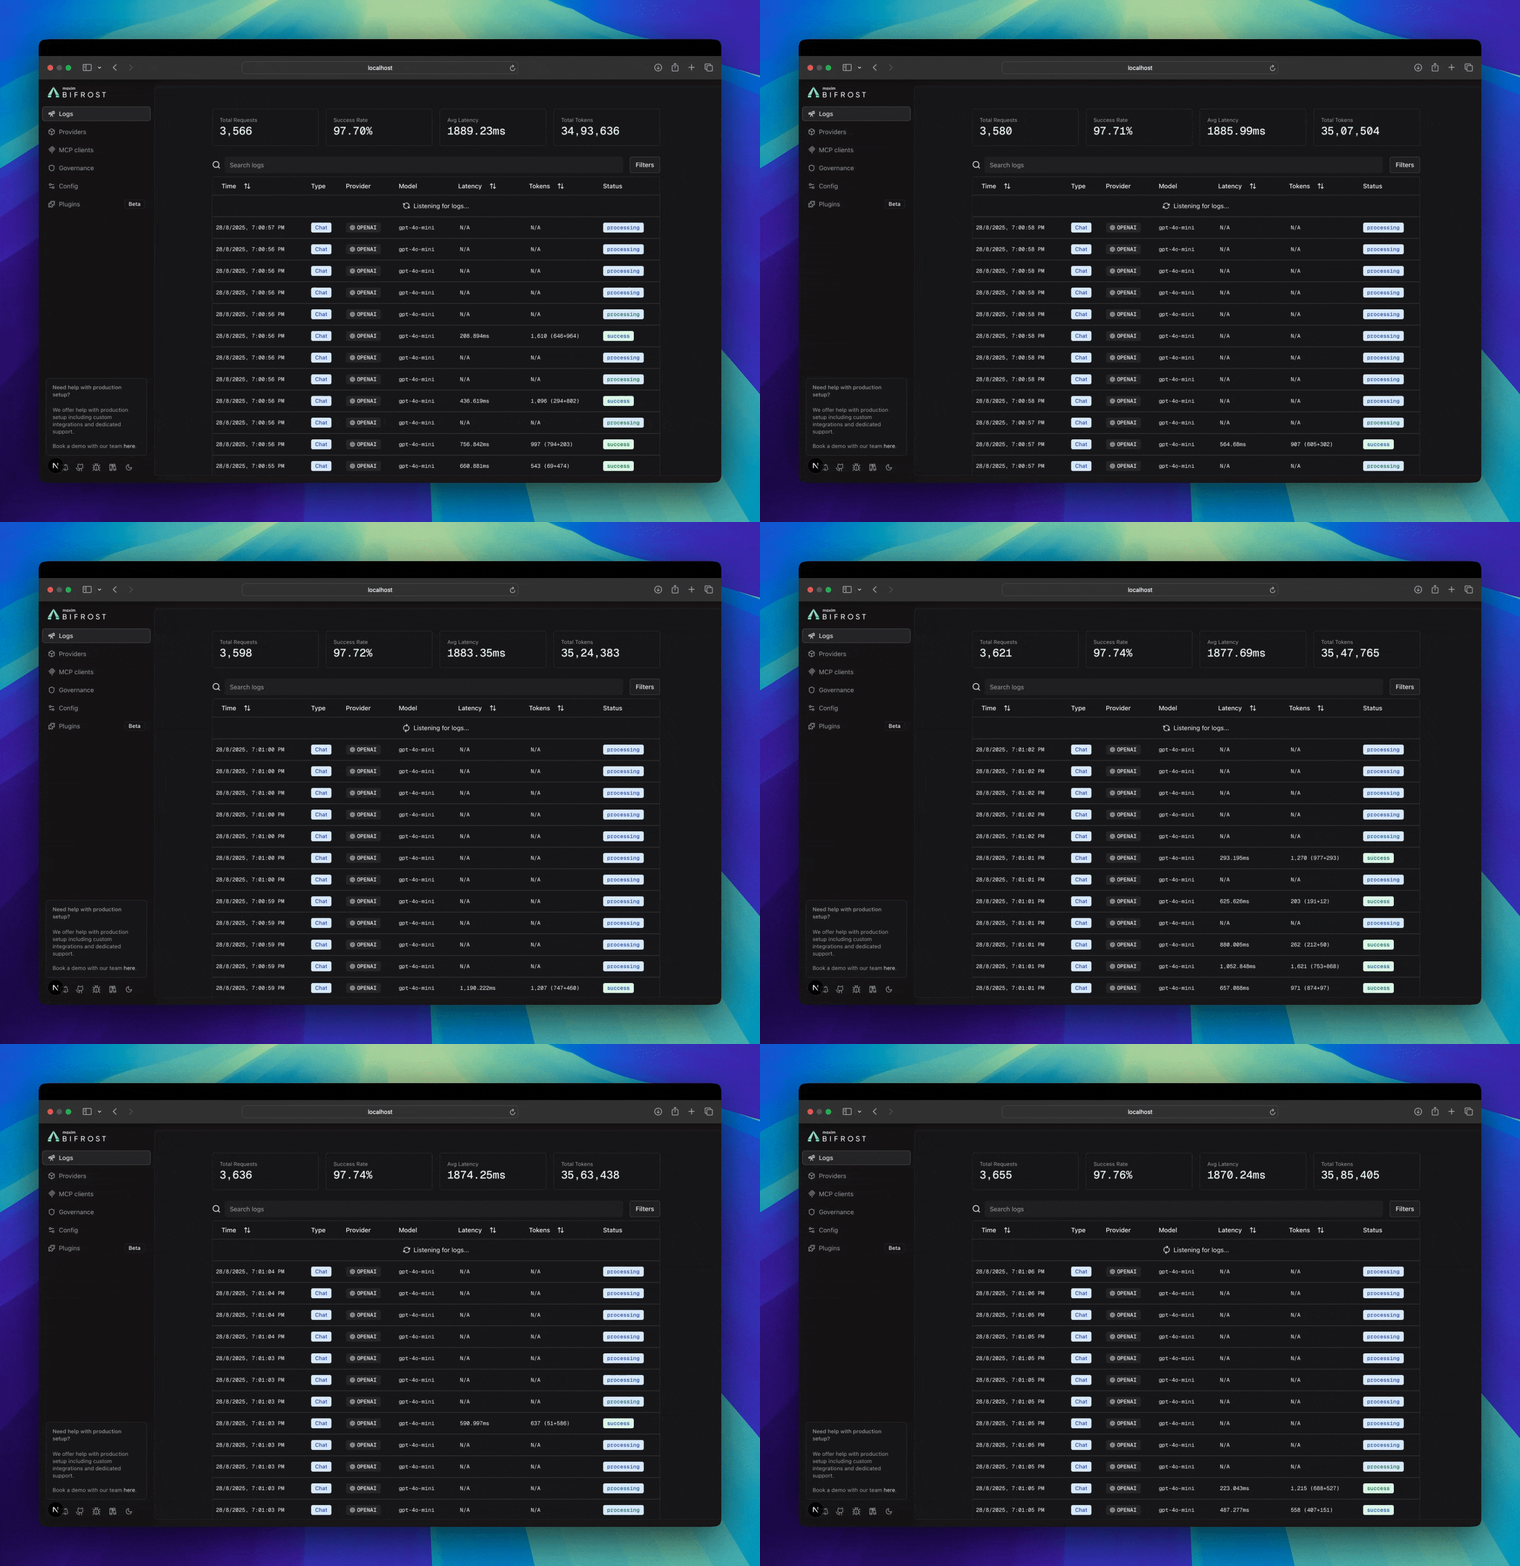
What’s Captured
Bifrost traces comprehensive information for every request, without any changes to your application code.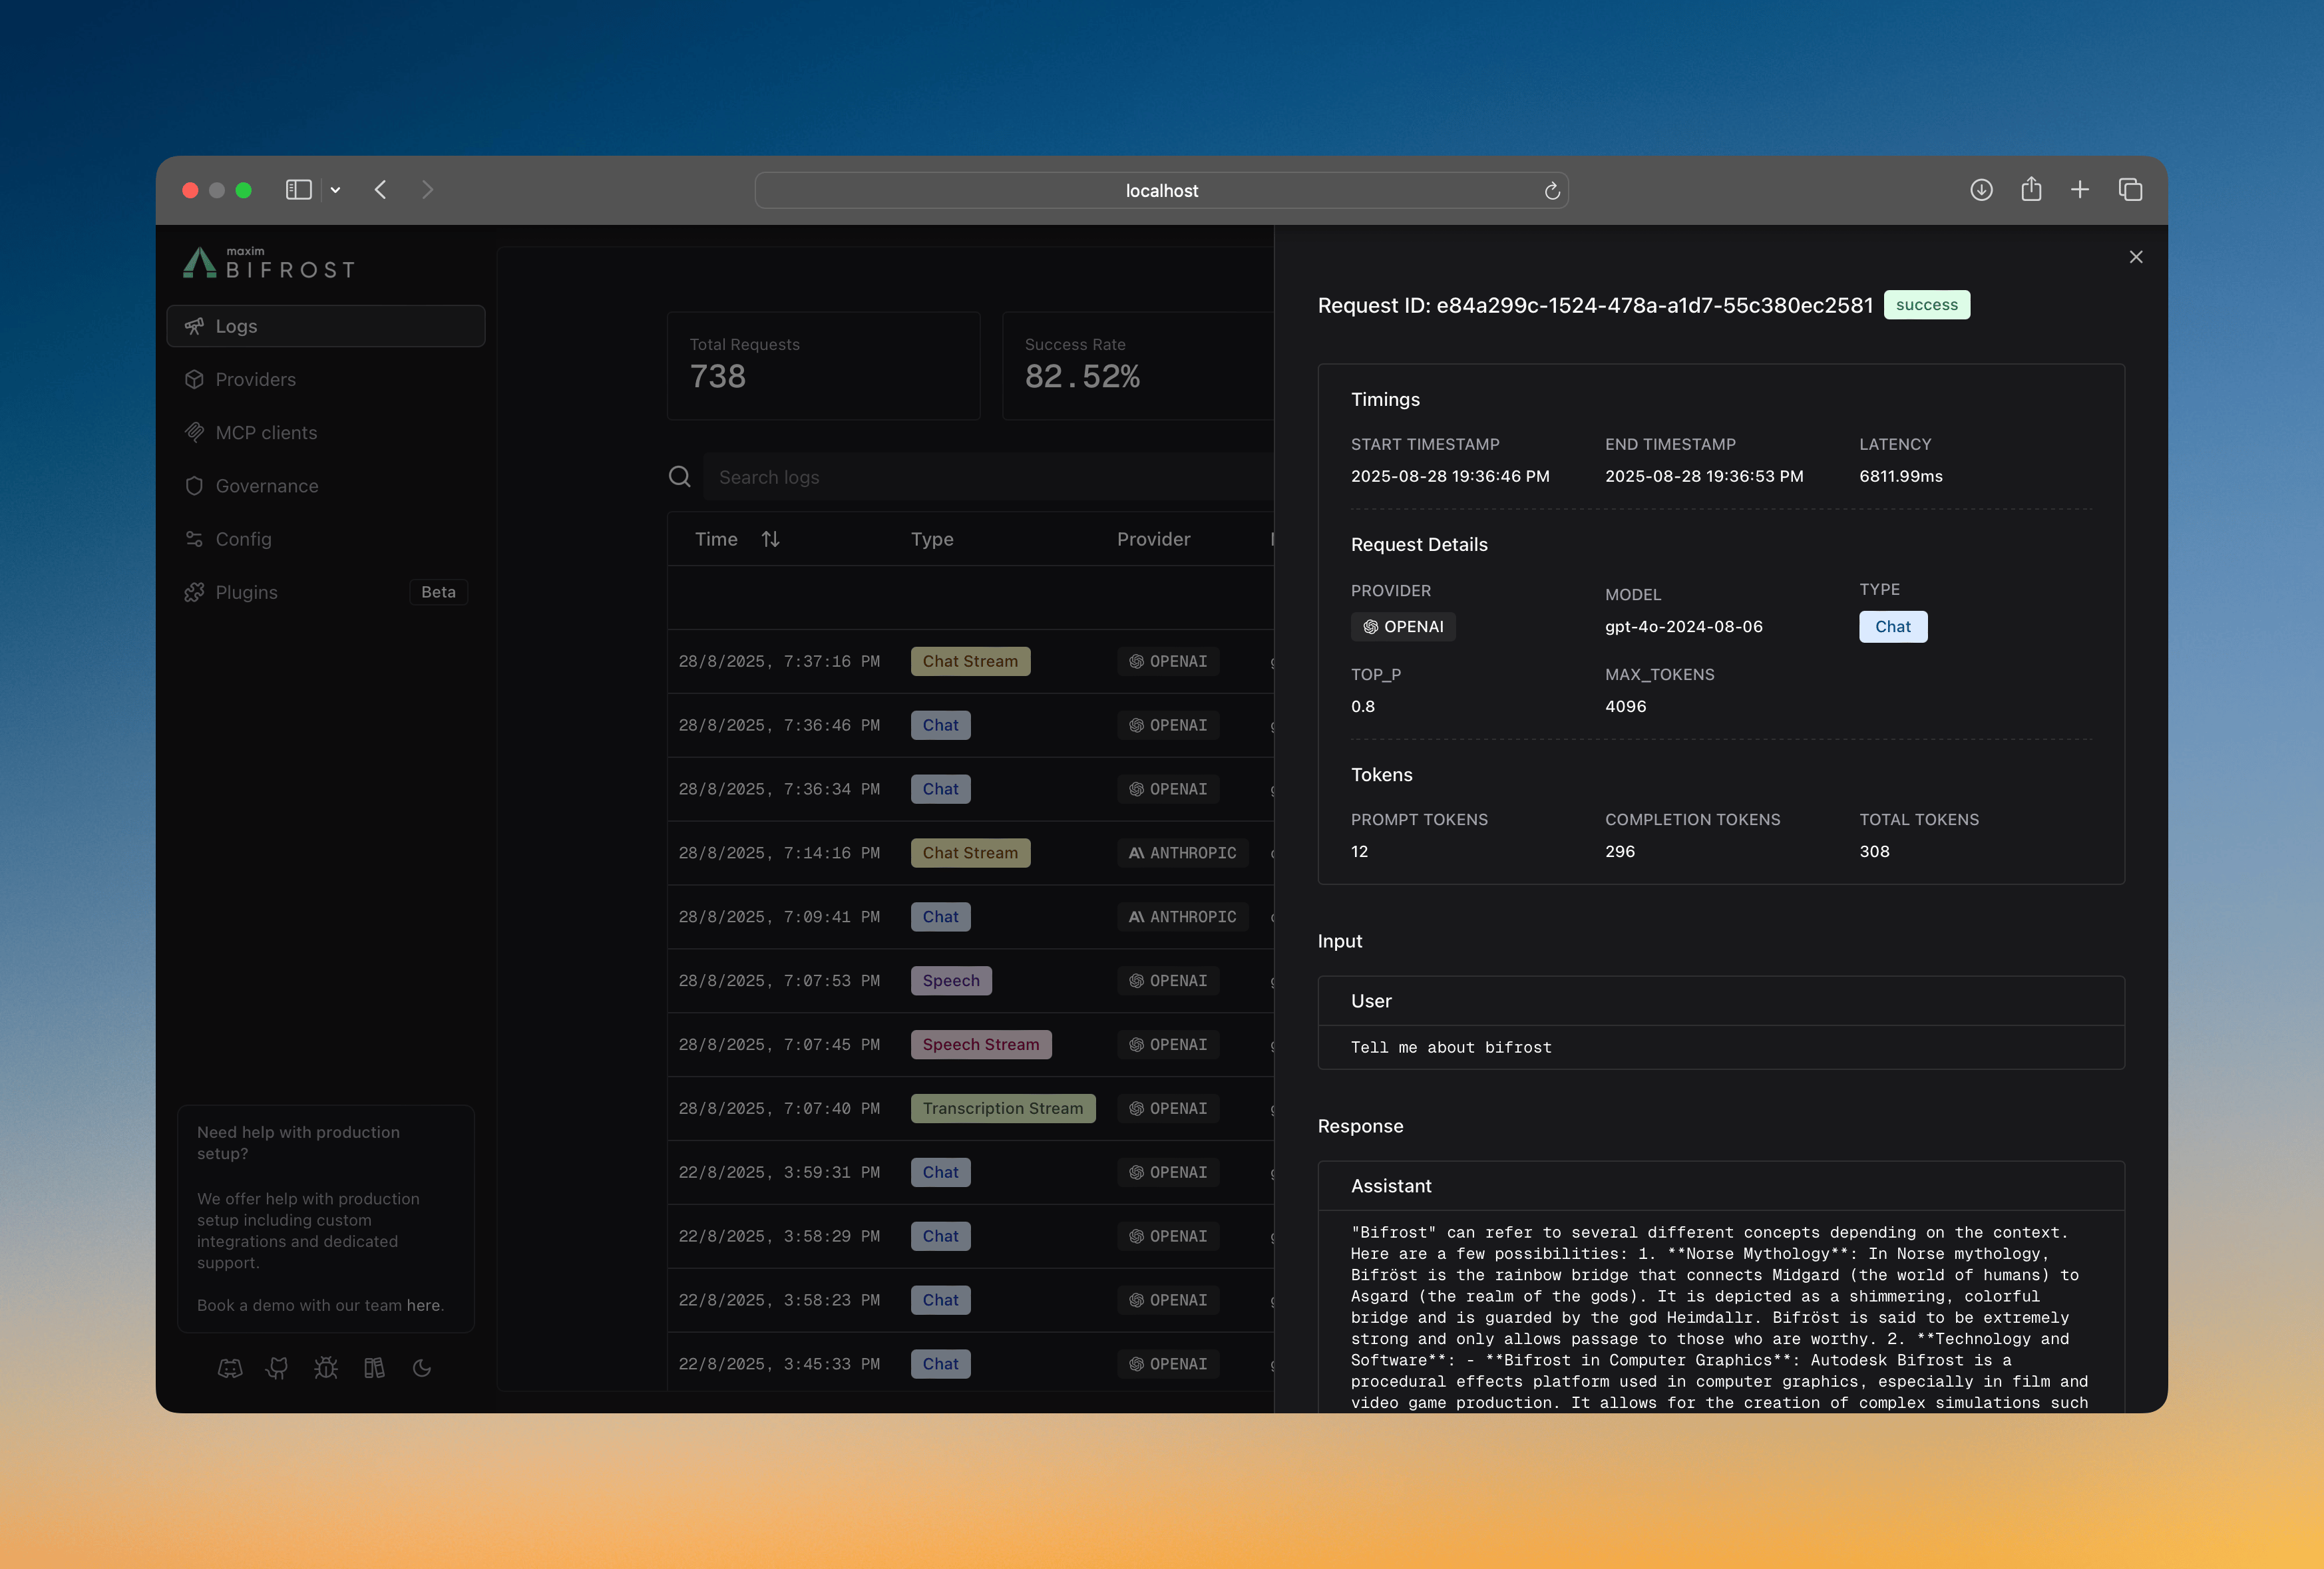
Request Data
- Input Messages: Complete conversation history and user prompts
- Model Parameters: Temperature, max tokens, tools, and all other parameters
- Provider Context: Which provider and model handled the request
- Prompt Tracking: When the Prompts plugin is active, the log captures the selected prompt name, version number, and ID for full traceability
Response Data
- Output Messages: AI responses, tool calls, and function results
- Performance Metrics: Latency and token usage
- Status Information: Success or error details
Guardrail Redaction
When Enterprise guardrail redaction is enabled, Bifrost logs store the redacted form of any content that the guardrail provider detected:runtimemode stores the same redacted content sent at runtime.logs_onlymode leaves runtime content raw but stores reversible placeholders in logs.runtime_reversiblemode stores the same reversible placeholders used at runtime.
redaction_mapping only for users with Logs:Reveal. If disable_content_logging is enabled, Bifrost skips request/response content and does not persist reveal data for that log.
For the full mode matrix, see Guardrail Redaction.
Retry & Key Selection v1.5.0-prerelease4+
When Bifrost retries a request (per-key failure or transient network/5xx error) the following fields are recorded:fail_reason is the class’s label for the classes that name what the provider refused: rate_limit_error, authentication_error, billing_error, model_access_error, model_retired_error, region_blocked_error. A timeout is request_timed_out, or ttft_timeout when a stream’s first-token limit cut it. A cancelled attempt has none. For other failures it is the provider’s own error type, falling back to unknown.
Example attempt_trail — two rate-limit rotations then success on a third key:
max_retries: 0. A rejected credential:
triggered_rotation is therefore false on network-error attempts even when a retry follows (a network error carries Bifrost’s own provider_connection_failed type and a synthetic 502):
fail_reason set and triggered_rotation false:
attempt_trail is null / absent when the request succeeded on the first try without retries.
Custom Metadata
- Logging Headers: Capture configured request headers (e.g.,
X-Tenant-ID) into log metadata - Ad-hoc Headers: Any
x-bf-lh-*prefixed header is automatically captured into metadata - See Logging Headers below for full details
Multimodal & Tool Support
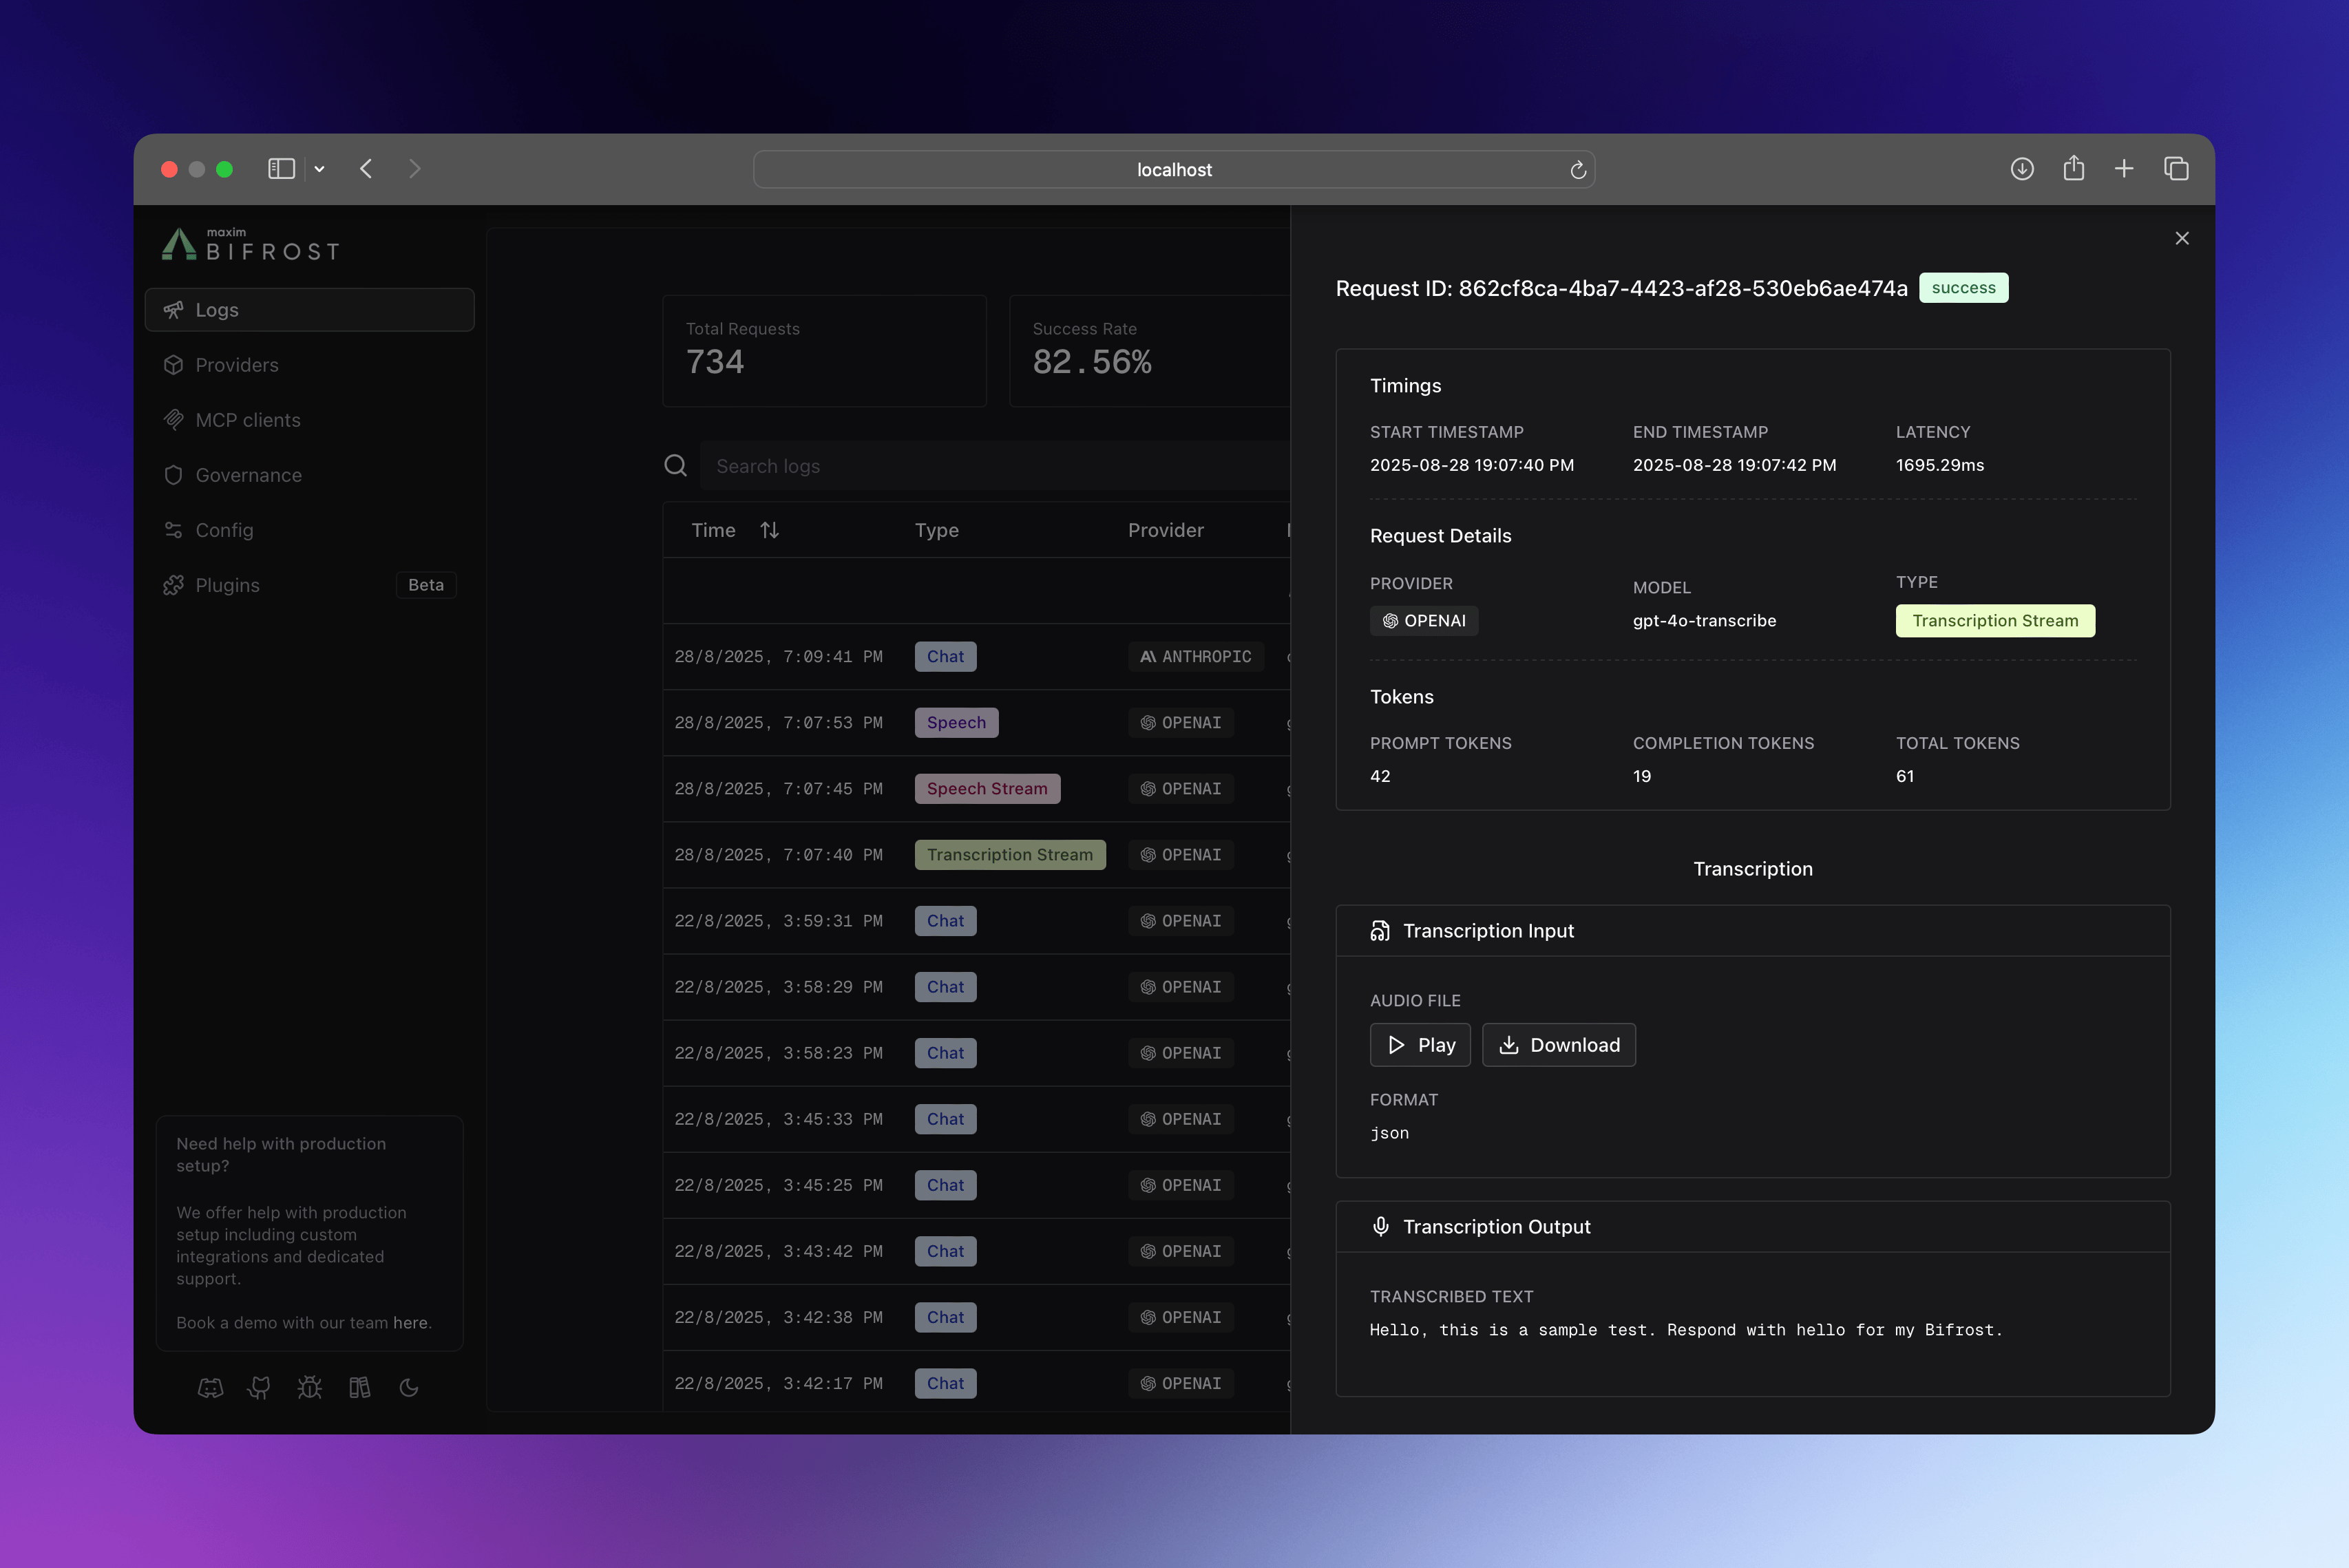
- Audio Processing: Speech synthesis and transcription inputs/outputs
- Vision Analysis: Image URLs and vision model responses
- Tool Execution: Function calling arguments and results
How It Works
The logging plugin intercepts all requests flowing through Bifrost using the plugin architecture, ensuring your LLM requests maintain optimal performance:- PreLLMHook: Captures request metadata (provider, model, input messages, parameters).
- Async Processing: Logs are written in background goroutines with
sync.Pooloptimization. - PostLLMHook: Updates log entry with response data (output, tokens, cost, latency, errors).
- Real-time Updates: WebSocket broadcasts keep the UI synchronized.
Configuration
Configure request tracing to control what gets logged and where it’s stored.- Using Web UI
- Using API
- Using config.json
- Using Go SDK
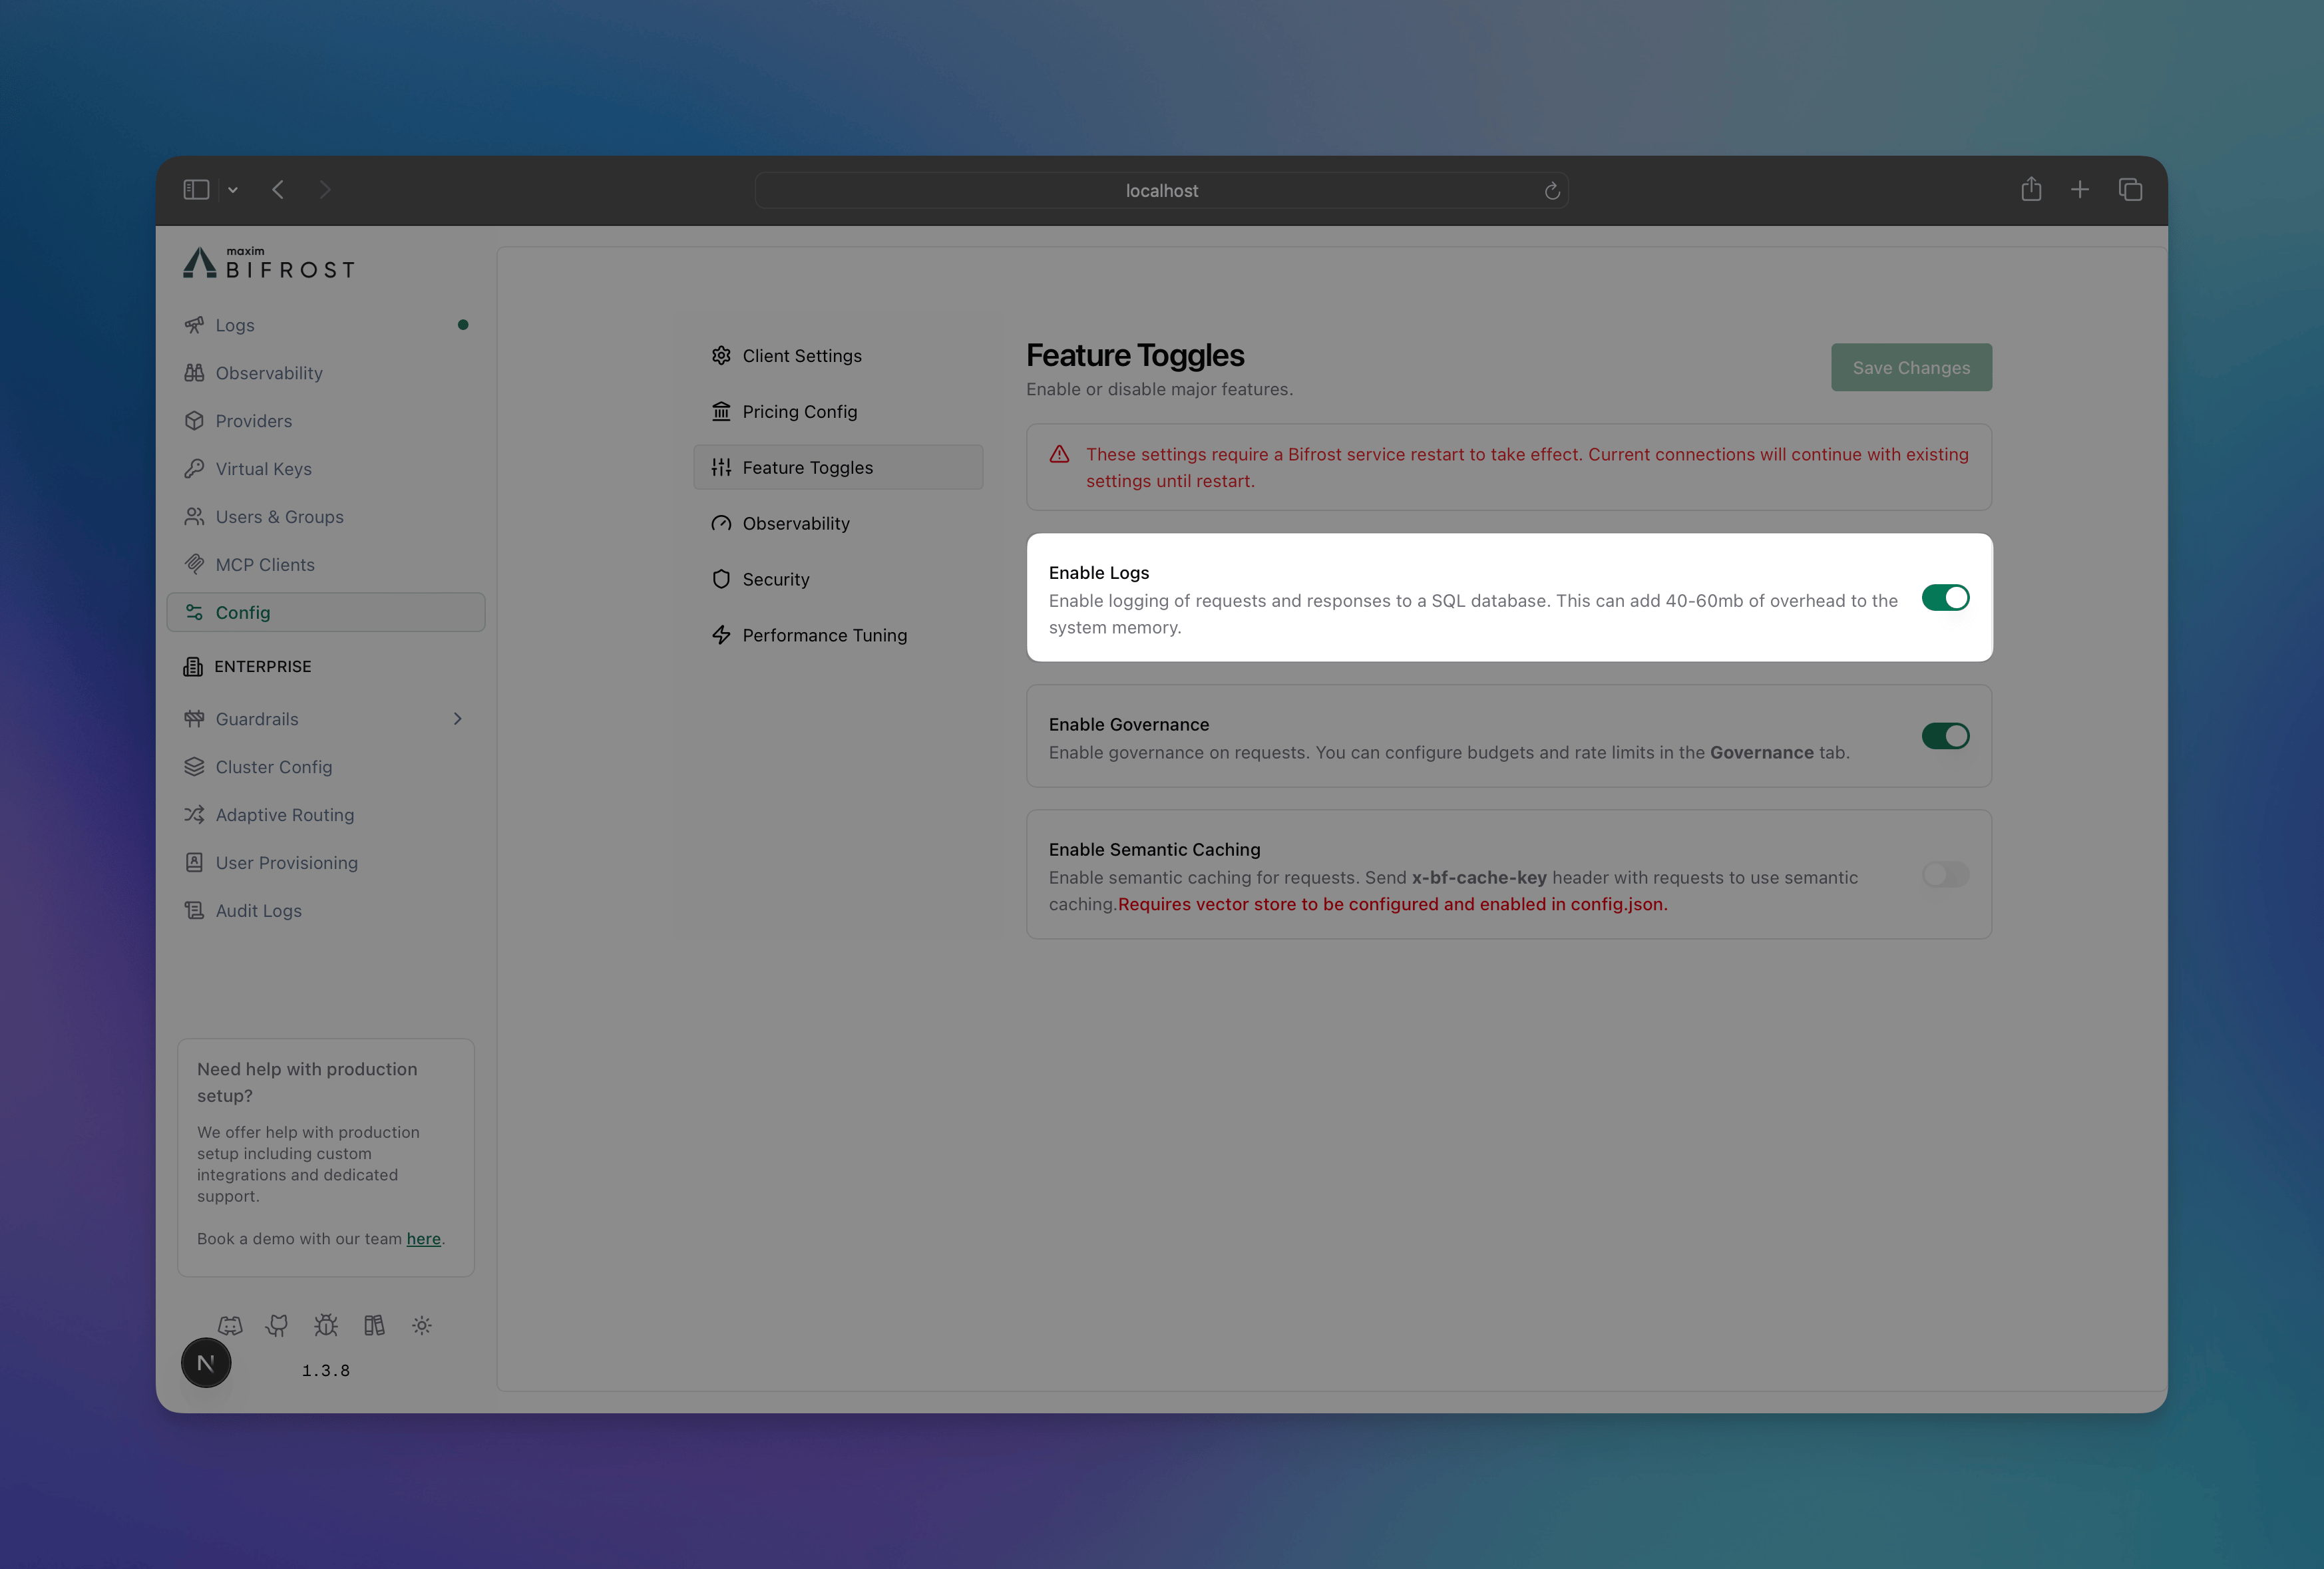
- Navigate to http://localhost:8080
- Go to “Settings”
- Toggle “Enable Logs”
Accessing & Filtering Logs
Retrieve and analyze logs with powerful filtering capabilities via the UI, API, and WebSockets.
Web UI
When running the Gateway, access the built-in dashboard athttp://localhost:8080. The UI provides:
- Real-time log streaming
- Advanced filtering and search
- Detailed request/response inspection
- Token and cost analytics
Grouped view
The Group button in the logs toolbar folds related requests into one row. The row’s label says what it holds:
Batch and video requests show
N linked for the settled-cost row that follows them.
Click the label to expand the row. Session requests have a blue left border and are numbered turn 2, turn 3 and so on. Fallback attempts have a grey border and read fallback 1, fallback 2. A session request with its own fallbacks gets its own toggle. Hover a label to see which key it groups by.
Grouping is off by default. Your choice is kept in the URL (grouped=true). It turns off while you filter to a single session_id or parent_request_id, since that is already one group. On very large log tables it can load slower than the flat view.
To group through the API, send roots_only=true, and add group_sessions=true to fold sessions too. Each row returns child_count, session_child_count, session_total_cost and session_total_tokens.
API Endpoints
Query logs programmatically using theGET request.
A log’s ID is its request ID, so
request_id is an exact primary-key lookup rather than a text
search. It takes precedence over the time range — start_time, end_time, and period are ignored
when it is set, so a request is found wherever it falls. roots_only is ignored too, so an ID naming
a fallback child returns that child rather than collapsing it into its root. In the dashboard, pasting
a request ID into the logs search box switches to this lookup automatically; prefix it with id: for
request IDs that aren’t UUIDs (any string supplied via the x-request-id header).WebSocket
Subscribe to real-time log updates for live monitoring:Background jobs
Long operations run in the background so you can keep using the page. Find them in the bell icon in the top bar, on the Background jobs tab. The bell always opens on Notifications. Each tab has a badge, showing unread notifications on one and running jobs on the other.
Each job shows its status and, if it reports progress, a progress bar. Totals are approximate, so a finished job’s count can be slightly off. To stop a running job, click Cancel on its row, then Stop job. A cancelled job does not resume. Dismiss a finished job from its row, or click Clear finished in the panel header to remove them all. On the Notifications tab, that spot holds Mark all read.
Only administrators see jobs. Without View on the
BackgroundJobs RBAC resource, the tab is hidden. Cancelling needs Update on the same resource.
GET /api/sidekiq/jobs returns all pending and running jobs, plus jobs finished in the last 24 hours. Results are newest first, up to 50.
Log Store Options
Choose the right storage backend for your scale and requirements. The logging plugin is automatically enabled in Gateway mode with SQLite storage by default. You can configure it to use PostgreSQL by setting thelogs_store configuration in your config.json file.
Current Support
- SQLite (Default)
- PostgreSQL
- Best for: Development, small-medium deployments
- Performance: Excellent for read-heavy workloads
- Setup: Zero configuration, single file storage
- Limits: Single-writer, local filesystem only
Planned Support
- MySQL: For traditional MySQL environments.
- ClickHouse: For large-scale analytics and time-series workloads.
Supported Request Types
The logging plugin captures all Bifrost request types:- Text Completion (streaming and non-streaming)
- Chat Completion (streaming and non-streaming)
- Responses (streaming and non-streaming)
- Embeddings
- Speech Generation (streaming and non-streaming)
- Transcription (streaming and non-streaming)
- Video Generation
Logging Headers
Capture specific HTTP request headers into the metadata field of every LLM and MCP log entry. This enables request tracing, tenant identification, and custom debugging without modifying your application code.How It Works
There are two ways headers get captured into log metadata: 1. Configured Logging Headers - Define a list of header names in the configuration. The logging plugin looks up each configured header (case-insensitive) and stores its value in the metadata. 2.x-bf-lh-* Prefix (Automatic) - Any request header with the x-bf-lh- prefix is automatically captured into metadata with no configuration needed. The prefix is stripped and the remainder becomes the metadata key.
Both methods can be used together - configured headers and
x-bf-lh-* headers are merged into the same metadata map.
Configuring Logging Headers
- Web UI
- API
- config.json
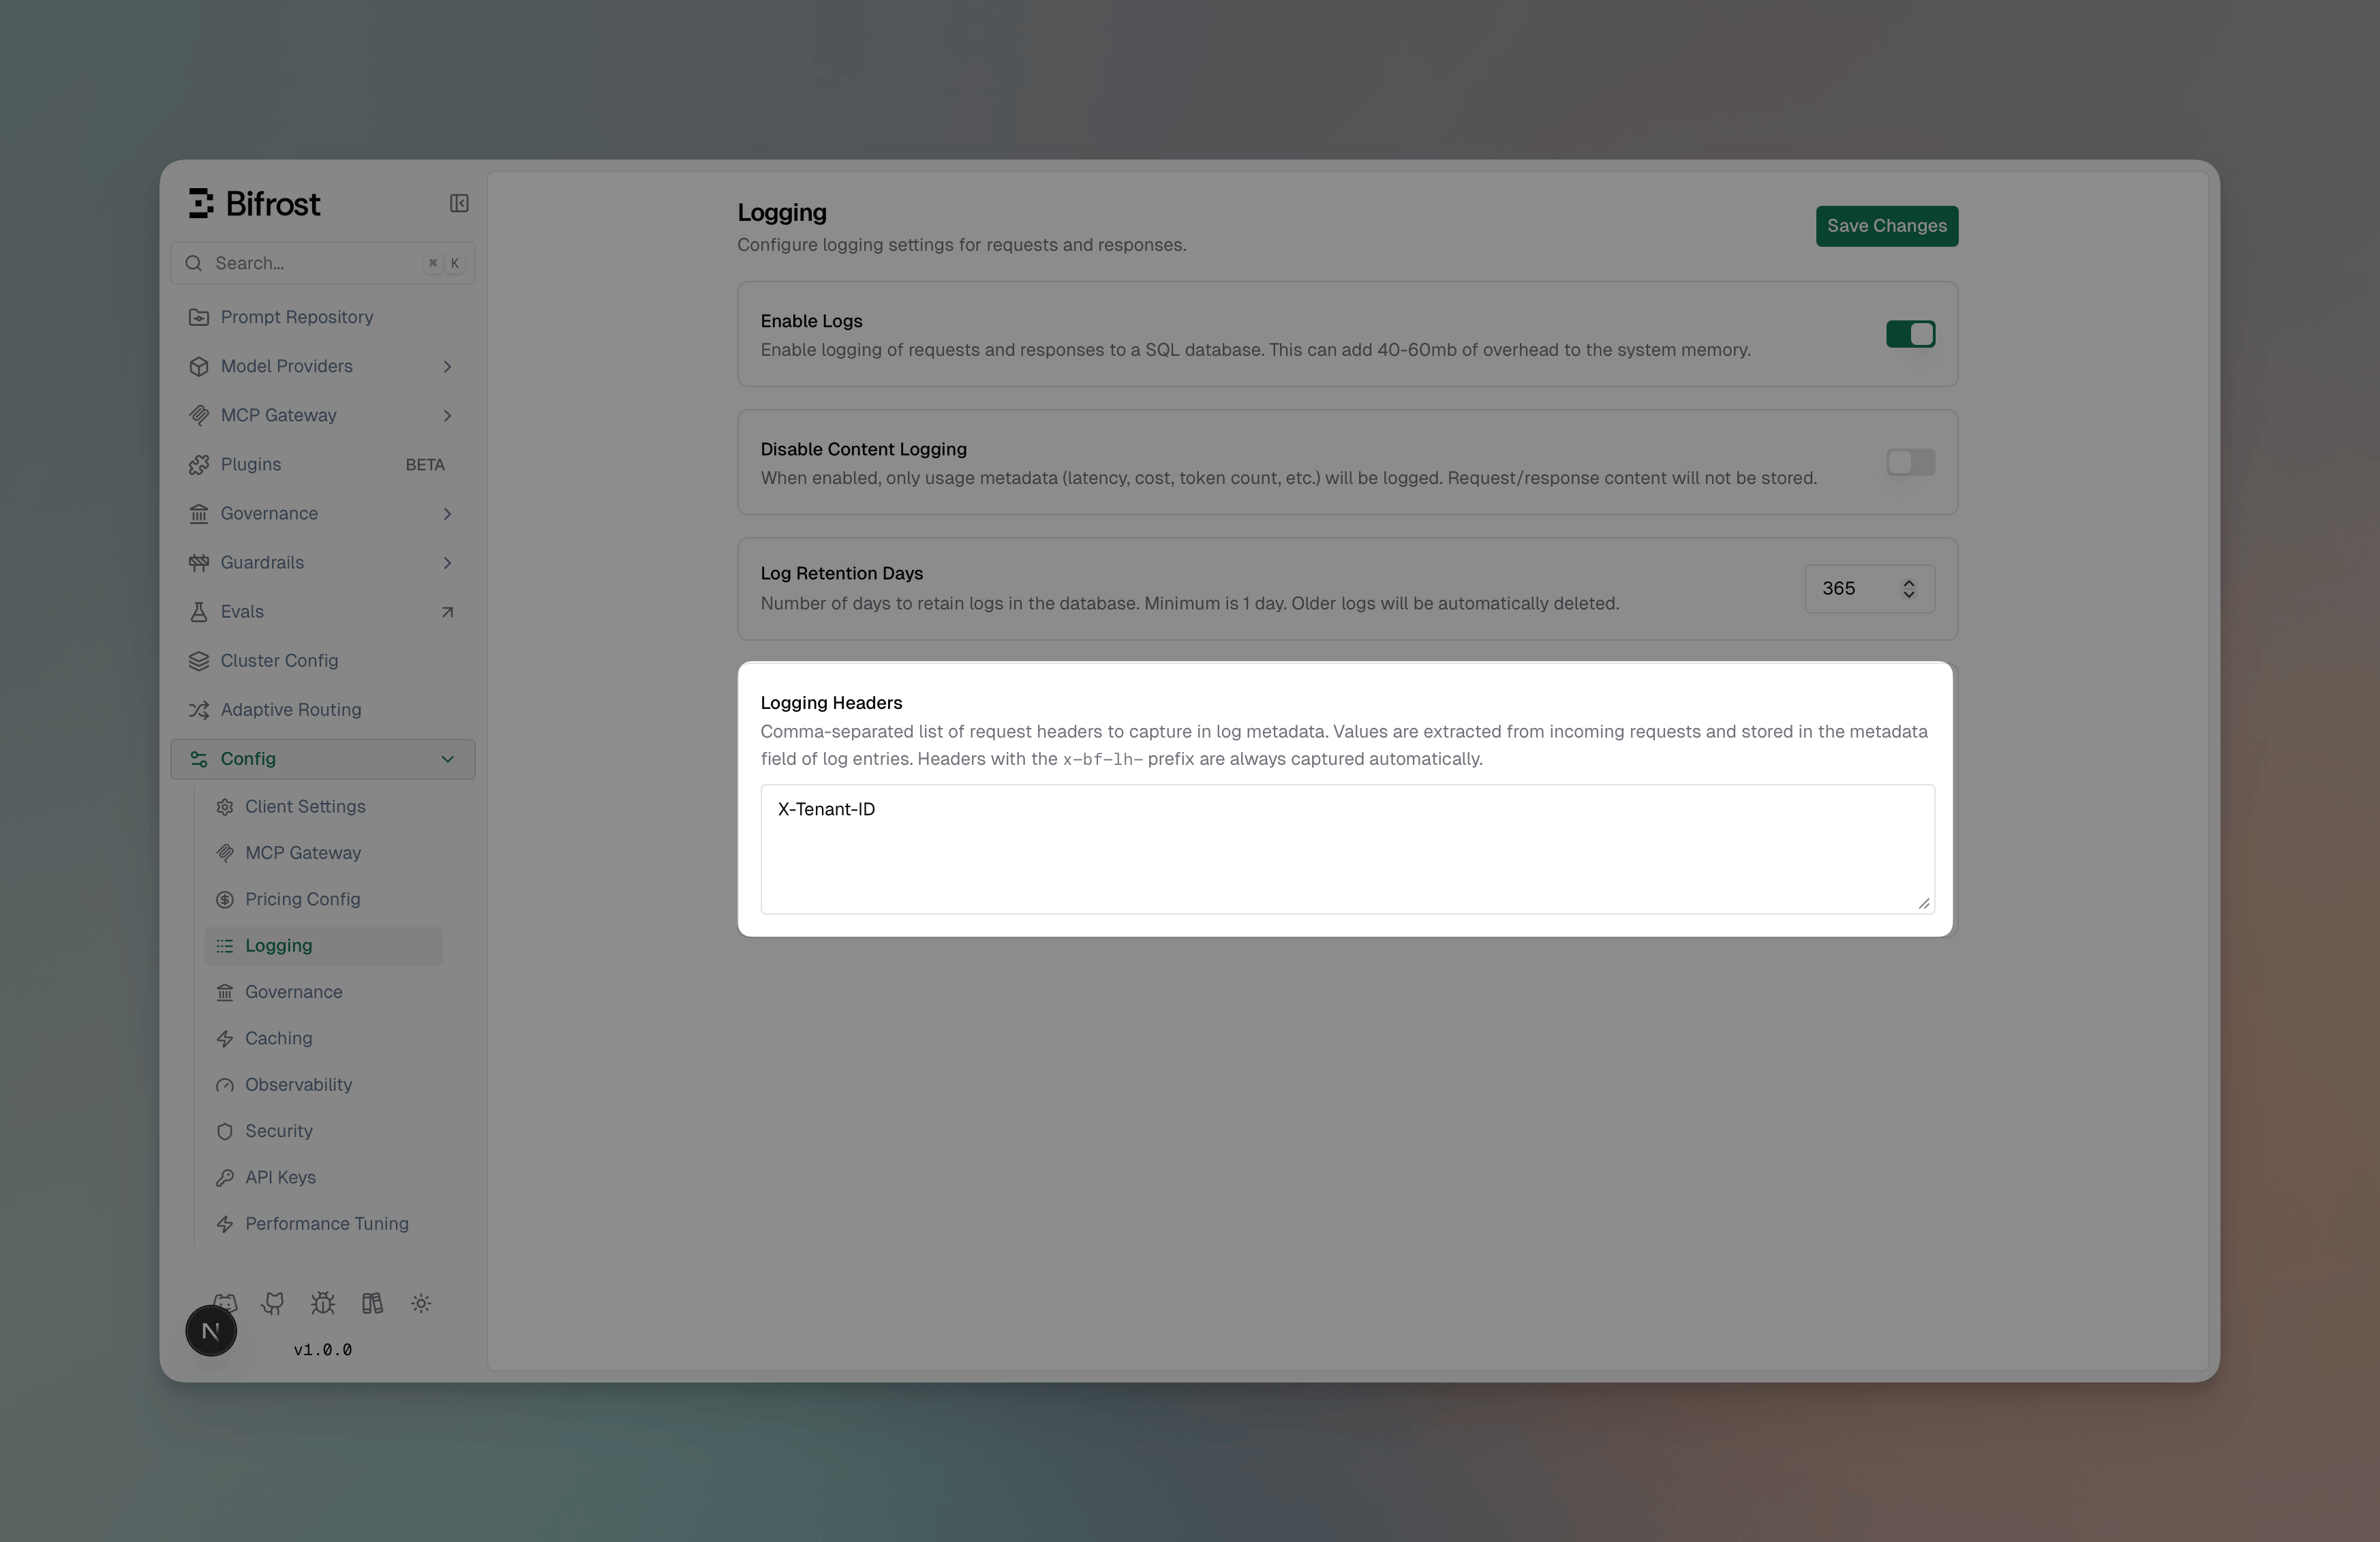
- Navigate to Config > Logging
- Ensure Enable Logs is toggled on
-
Scroll to Logging Headers
-
Enter a comma-separated list of header names (e.g.,
X-Tenant-ID, X-Correlation-ID) - Click Save Changes
Usage Examples
Configured headers:{"x-tenant-id": "tenant-123", "x-correlation-id": "req-abc-456"}
Ad-hoc x-bf-lh-* headers (no config needed):
{"env": "production", "version": "v2.1.0"}
Viewing Metadata in the UI
Metadata is displayed in the log detail view for both LLM and MCP logs as individual key-value entries alongside other request details.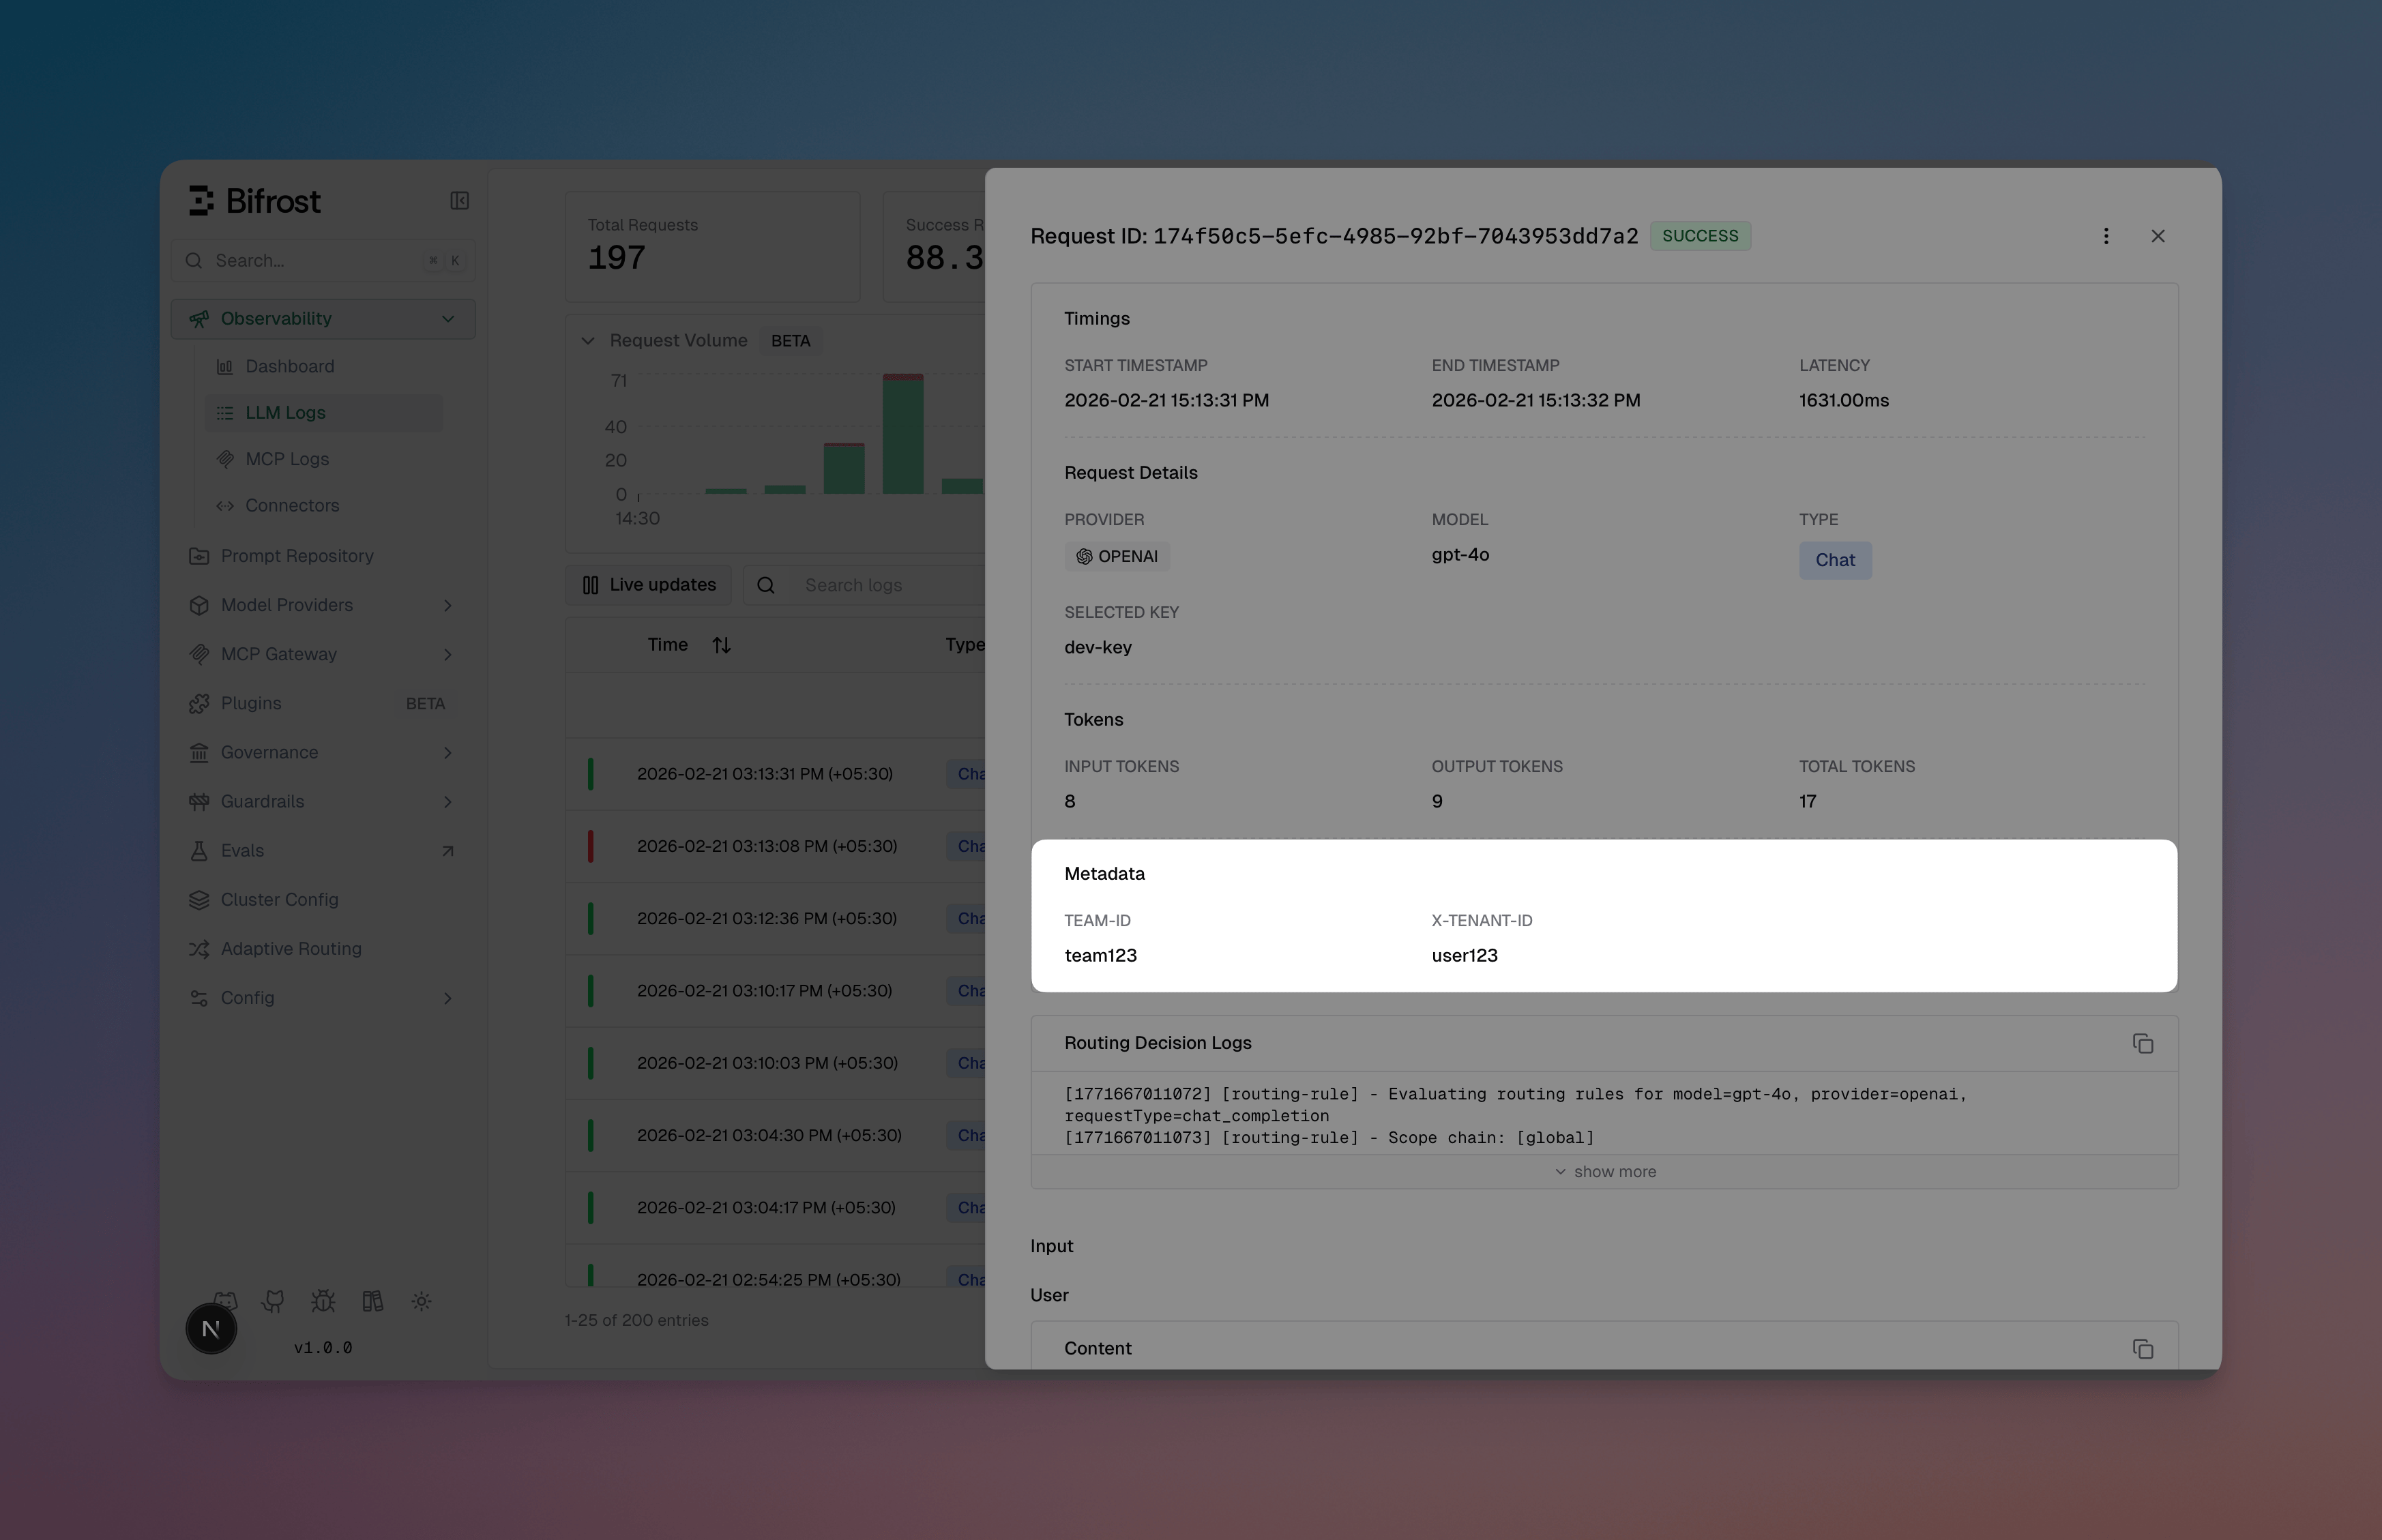
Combining with Required Headers
Required headers and logging headers serve different purposes and can be used together:
A common pattern is to require a header and log it:
When to Use
Built-in Observability
Use the built-in logging plugin for:- Local Development: Quick setup with SQLite, no external dependencies
- Self-hosted Deployments: Full control over your data with PostgreSQL
- Simple Use Cases: Basic monitoring and debugging needs
- Privacy-sensitive Workloads: Keep all logs on your infrastructure
vs. Maxim Plugin
Switch to the Maxim plugin for:- Advanced evaluation and testing workflows
- Prompt engineering and experimentation
- Multi-team governance and collaboration
- Production monitoring with alerts and SLAs
- Dataset management and annotation pipelines
vs. OTel Plugin
Switch to the OTel plugin for:- Integration with existing observability infrastructure
- Correlation with application traces and metrics
- Custom collector configurations
- Compliance and enterprise requirements
Performance
The logging plugin is designed for zero-impact observability:- Async Operations: All database writes happen in background goroutines
- Sync.Pool: Reuses memory allocations for LogMessage and UpdateLogData structs
- Batch Processing: Efficiently handles high request volumes
- Automatic Cleanup: Removes stale processing logs every 30 seconds
Connectors
Maxim AI
Comprehensive LLM observability and evaluation.
OpenTelemetry
OTLP integration for distributed tracing.
Prometheus
Native Prometheus metrics.
Datadog
Native APM, LLM Observability, and metrics.
Next Steps
- Gateway Setup - Get Bifrost running with tracing enabled
- Provider Configuration - Configure multiple providers for better insights
- Telemetry - Prometheus metrics and dashboards
- Governance - Virtual keys and usage limits