> ## Documentation Index
> Fetch the complete documentation index at: https://bifrost-dev.mintlify.site/llms.txt
> Use this file to discover all available pages before exploring further.
# Read Agent Logs
> Follow a session into agent operations, stream events, artifacts, model calls, and tool calls.
Start with the conversation, then narrow down to the task and operation that needs attention. **Observability → Agent Logs** shows the traffic Bifrost handled for your registered agents.
## Find the request
1. Choose a time window that includes the request.
2. Filter by agent, status, task state, or caller. Enterprise deployments also expose the available user, project, team, customer, and business-unit filters according to your access.
3. Open an operation to inspect its details, or use session grouping to follow the conversation.
Search matches log metadata such as agent, operation, IDs, and errors. It does not search the contents of every message or artifact.
For these screenshots, we sent two questions to our research agent in one conversation and ran a separate travel-agent example. Your logs will contain your own agents, messages, and IDs.
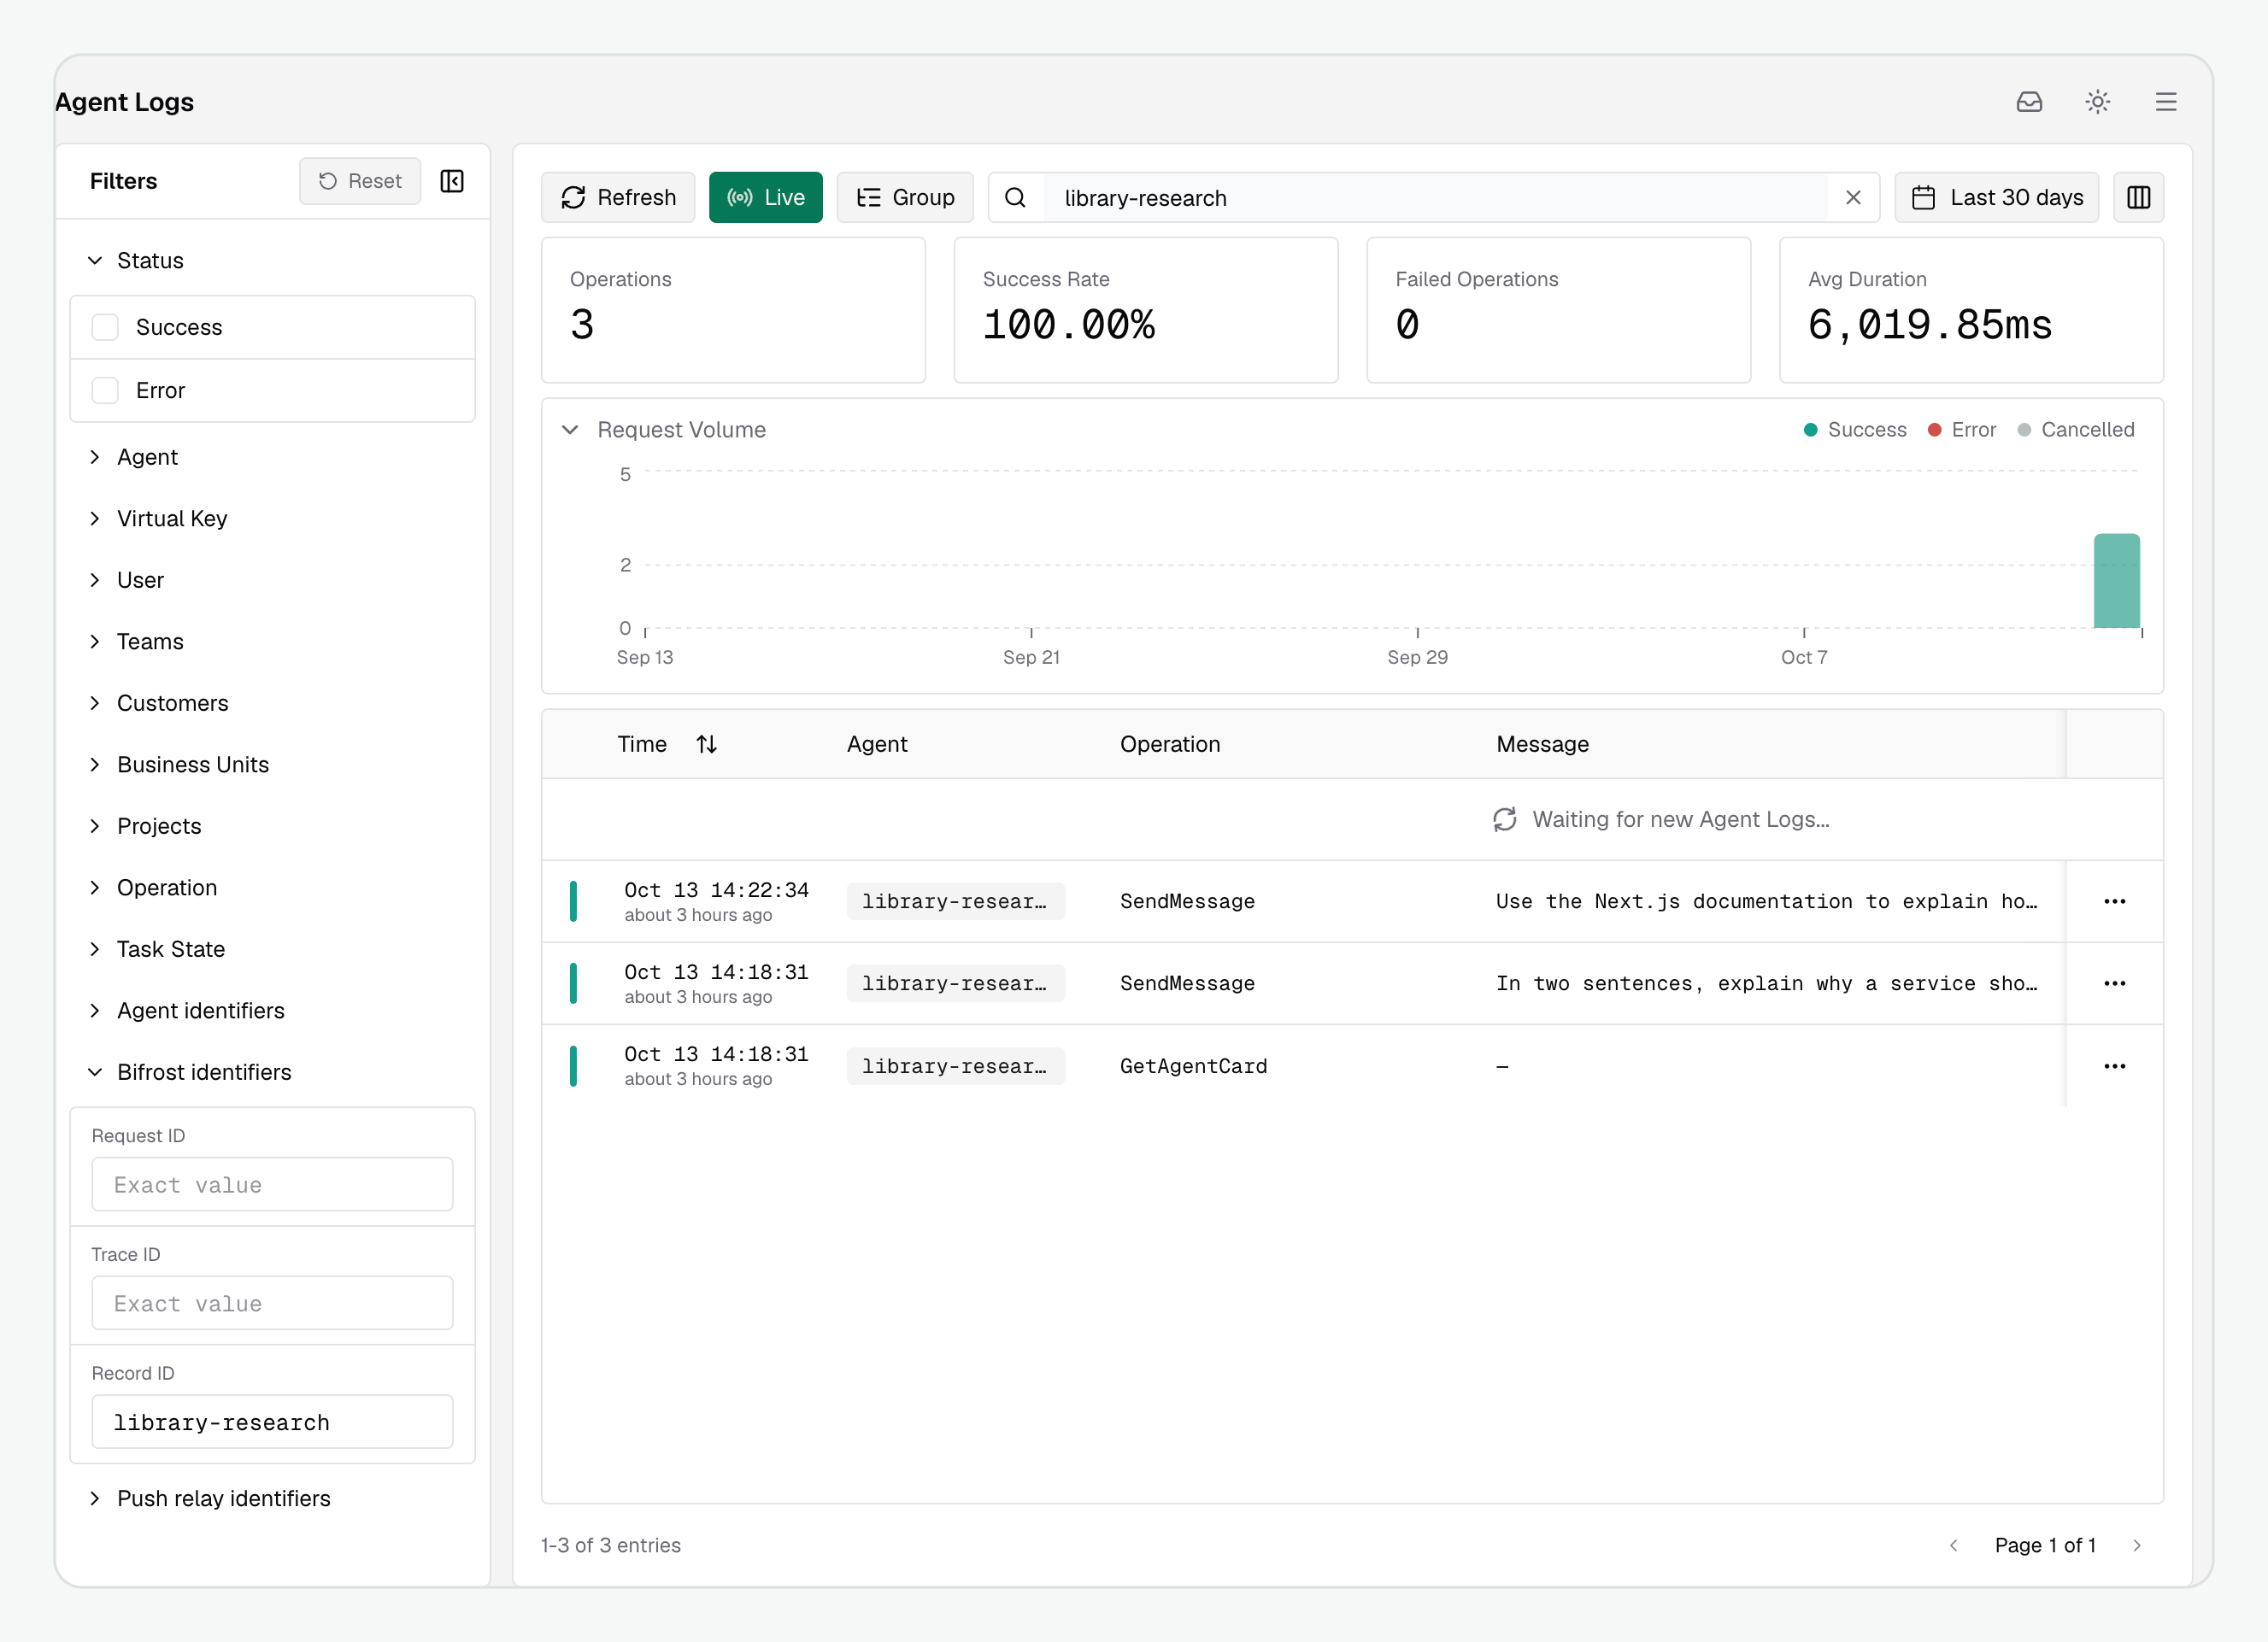 Click a displayed ID to filter by it. Right-click it to copy its value. Filters live in the page URL, so you can share a filtered view with someone who has access to those logs.
## Follow a session
Session grouping uses the A2A context ID. A session can contain several tasks and operations, including follow-up messages, task reads, cancellation, and subscriptions.
Open the **Agent session** to see:
* **Operations** for the conversation, with stream events beneath their operation.
* **LLM Logs** for model calls whose session ID matches the context ID.
* **MCP Logs** for tool calls with that same session ID.
Use each list's pagination controls to continue through longer sessions. Changing the selected tab does not mean all of the conversation's logs have loaded at once. Operations without a context ID, such as initial card discovery, stay as individual rows.
The Group toggle groups matching request operations by context before paginating the session rows. A filter still applies inside those groups, so the displayed operation count can describe only the matching portion of a conversation. Stream events do not increase that operation count.
To connect model and tool calls, your agent must [send the correlation headers](./integrating-your-agent). The gateway cannot infer those IDs from a separate model request.
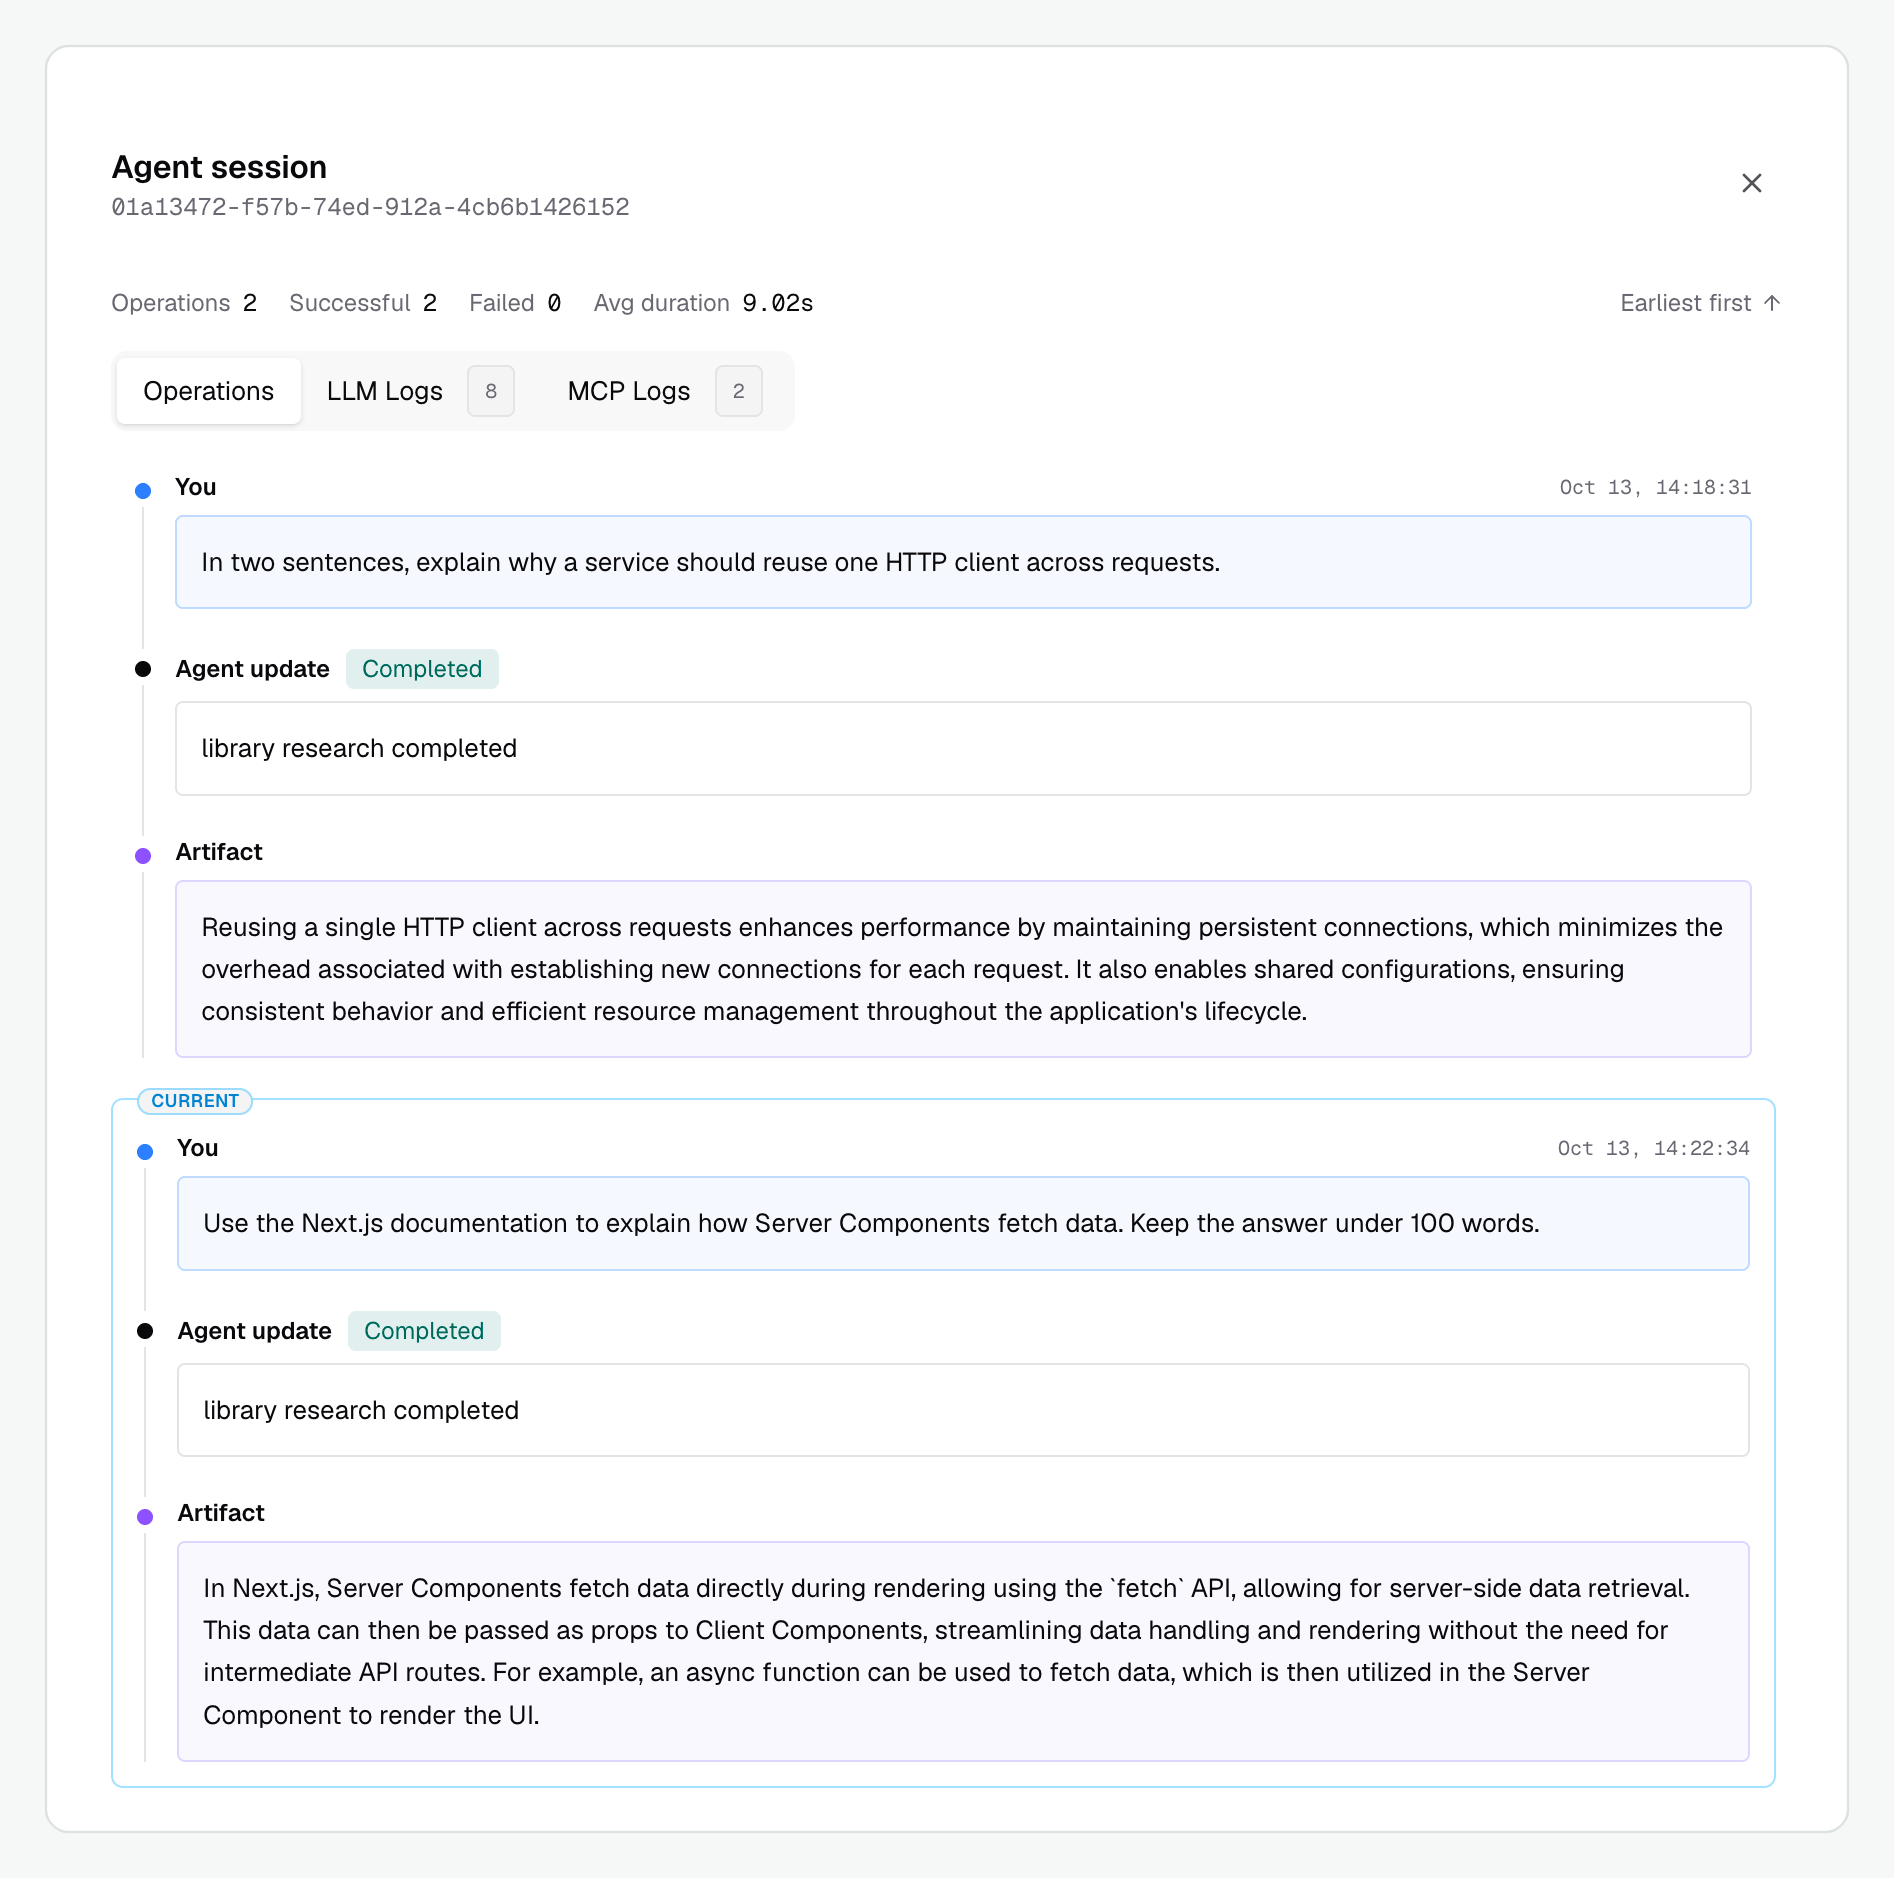
We opened our research session to see both requests and the agent's responses in one conversation.
Click a displayed ID to filter by it. Right-click it to copy its value. Filters live in the page URL, so you can share a filtered view with someone who has access to those logs.
## Follow a session
Session grouping uses the A2A context ID. A session can contain several tasks and operations, including follow-up messages, task reads, cancellation, and subscriptions.
Open the **Agent session** to see:
* **Operations** for the conversation, with stream events beneath their operation.
* **LLM Logs** for model calls whose session ID matches the context ID.
* **MCP Logs** for tool calls with that same session ID.
Use each list's pagination controls to continue through longer sessions. Changing the selected tab does not mean all of the conversation's logs have loaded at once. Operations without a context ID, such as initial card discovery, stay as individual rows.
The Group toggle groups matching request operations by context before paginating the session rows. A filter still applies inside those groups, so the displayed operation count can describe only the matching portion of a conversation. Stream events do not increase that operation count.
To connect model and tool calls, your agent must [send the correlation headers](./integrating-your-agent). The gateway cannot infer those IDs from a separate model request.
We opened our research session to see both requests and the agent's responses in one conversation.
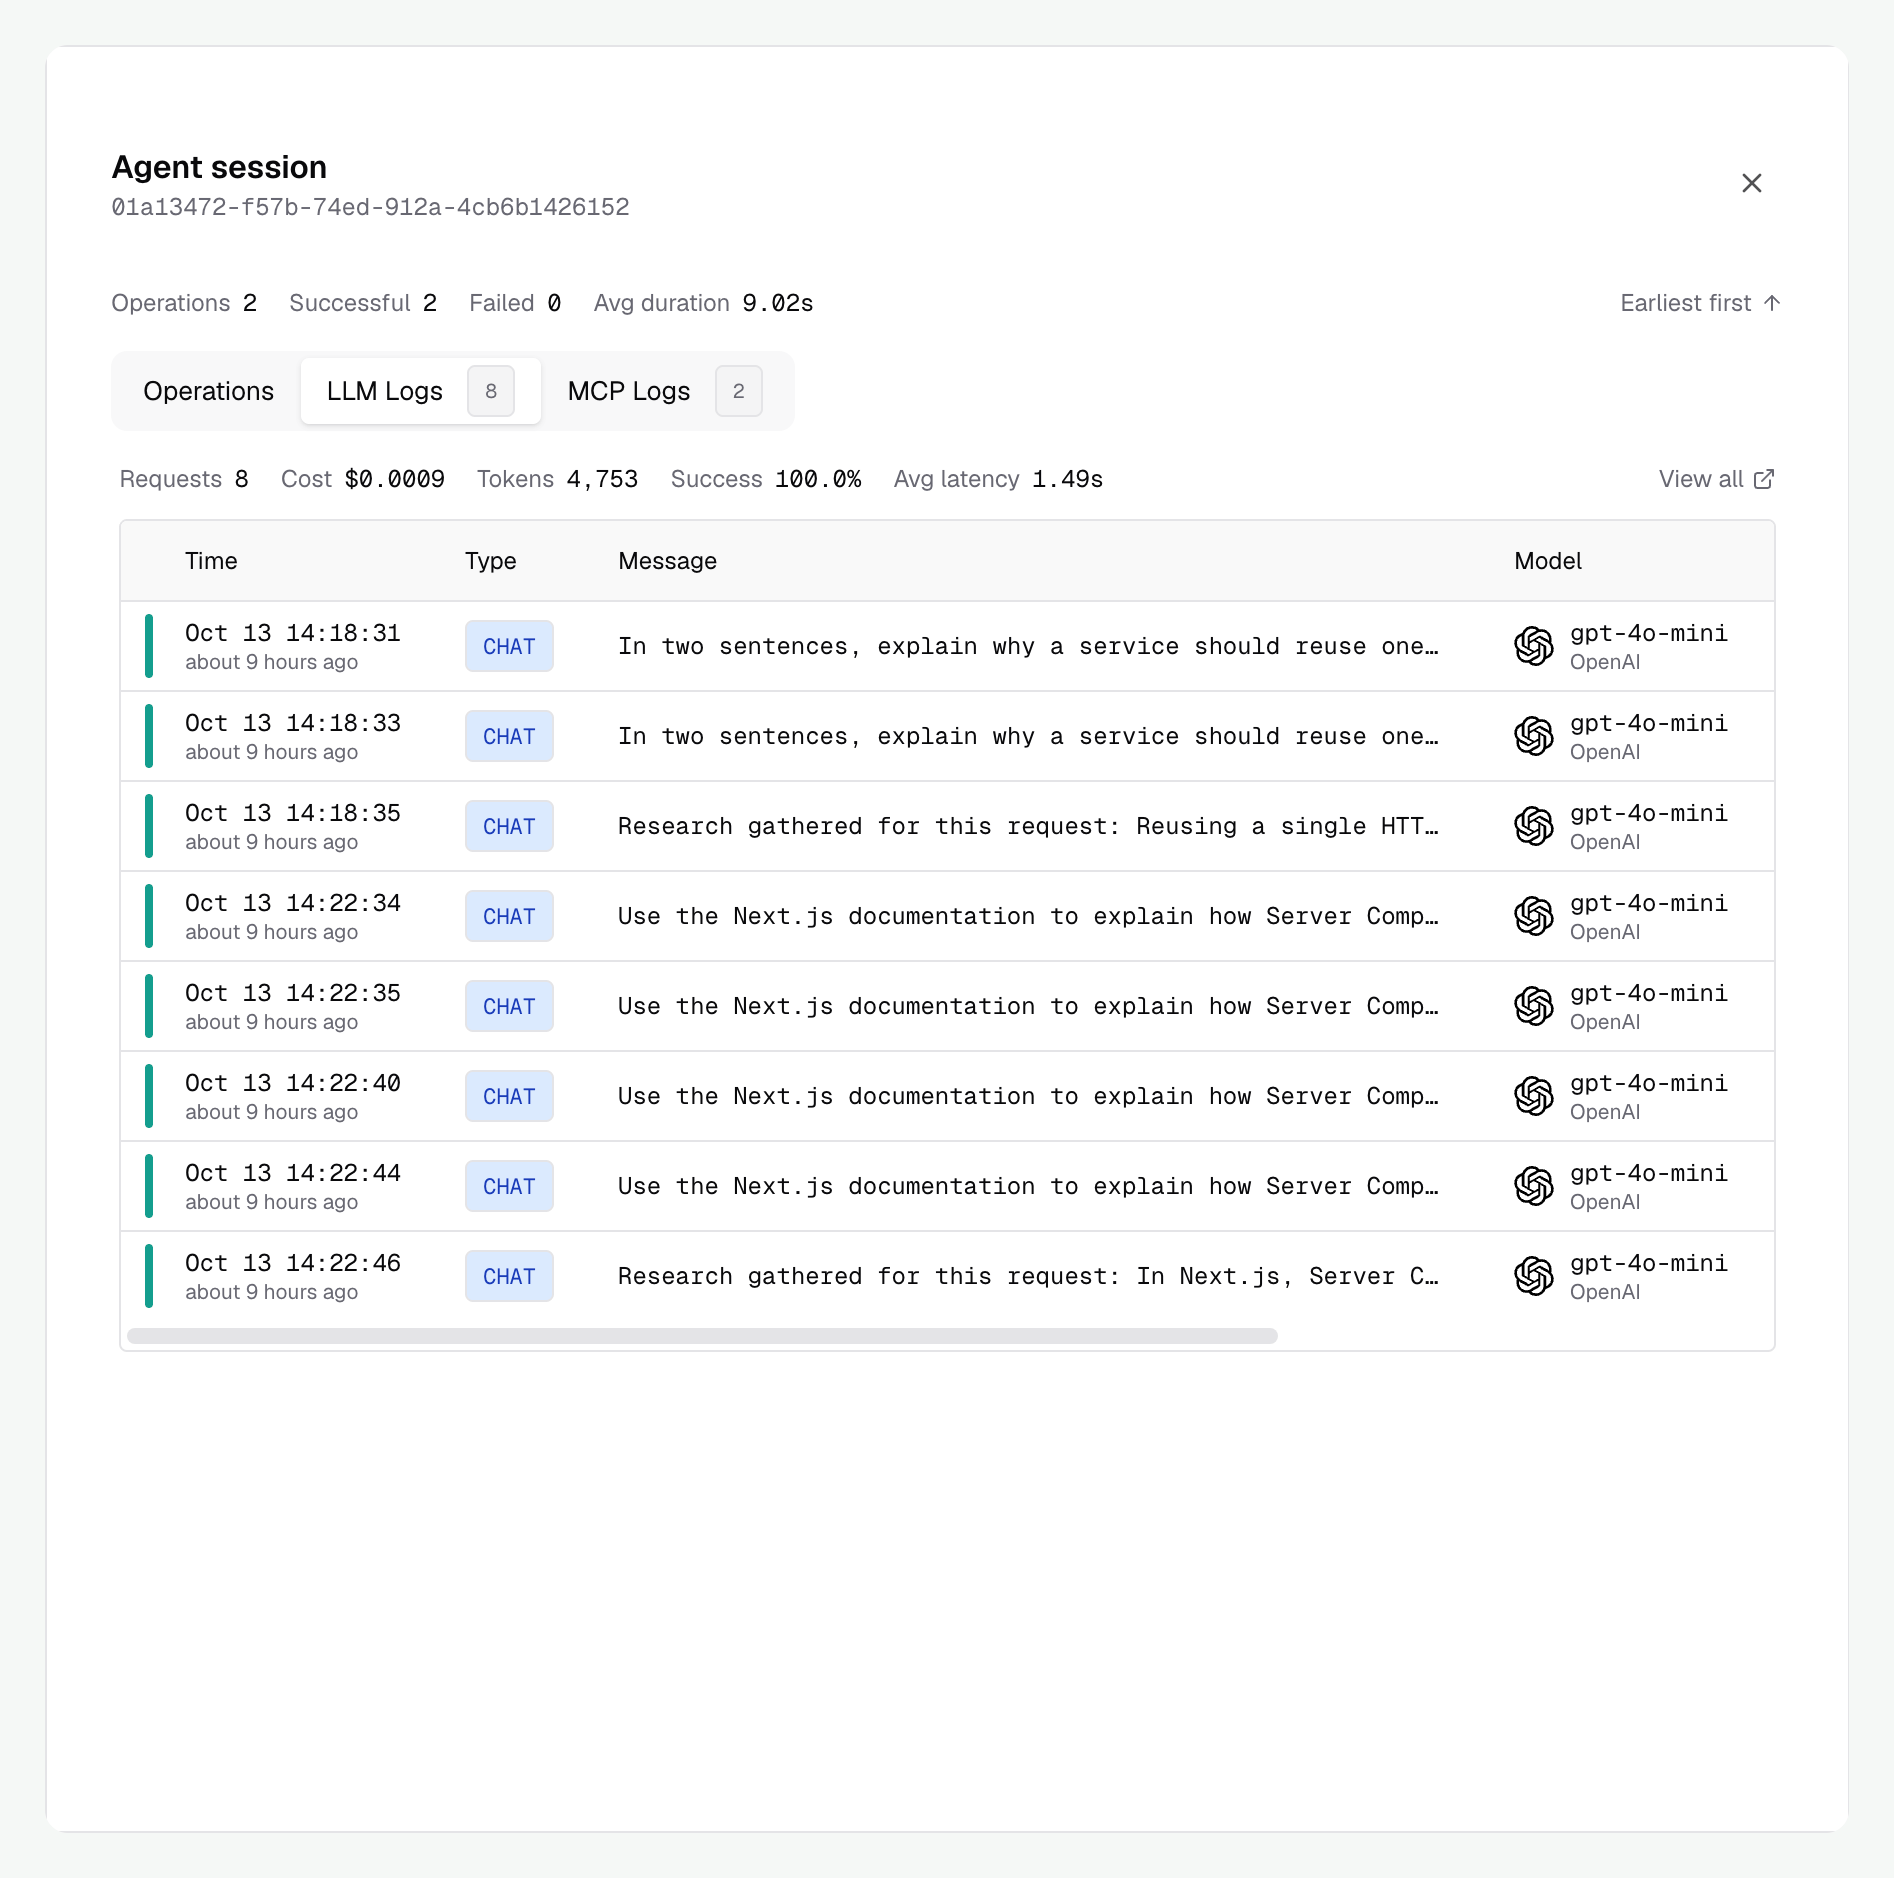
 We selected **LLM Logs** on the same session. Its eight model calls span both research requests, with latency, tokens, and cost for each call.
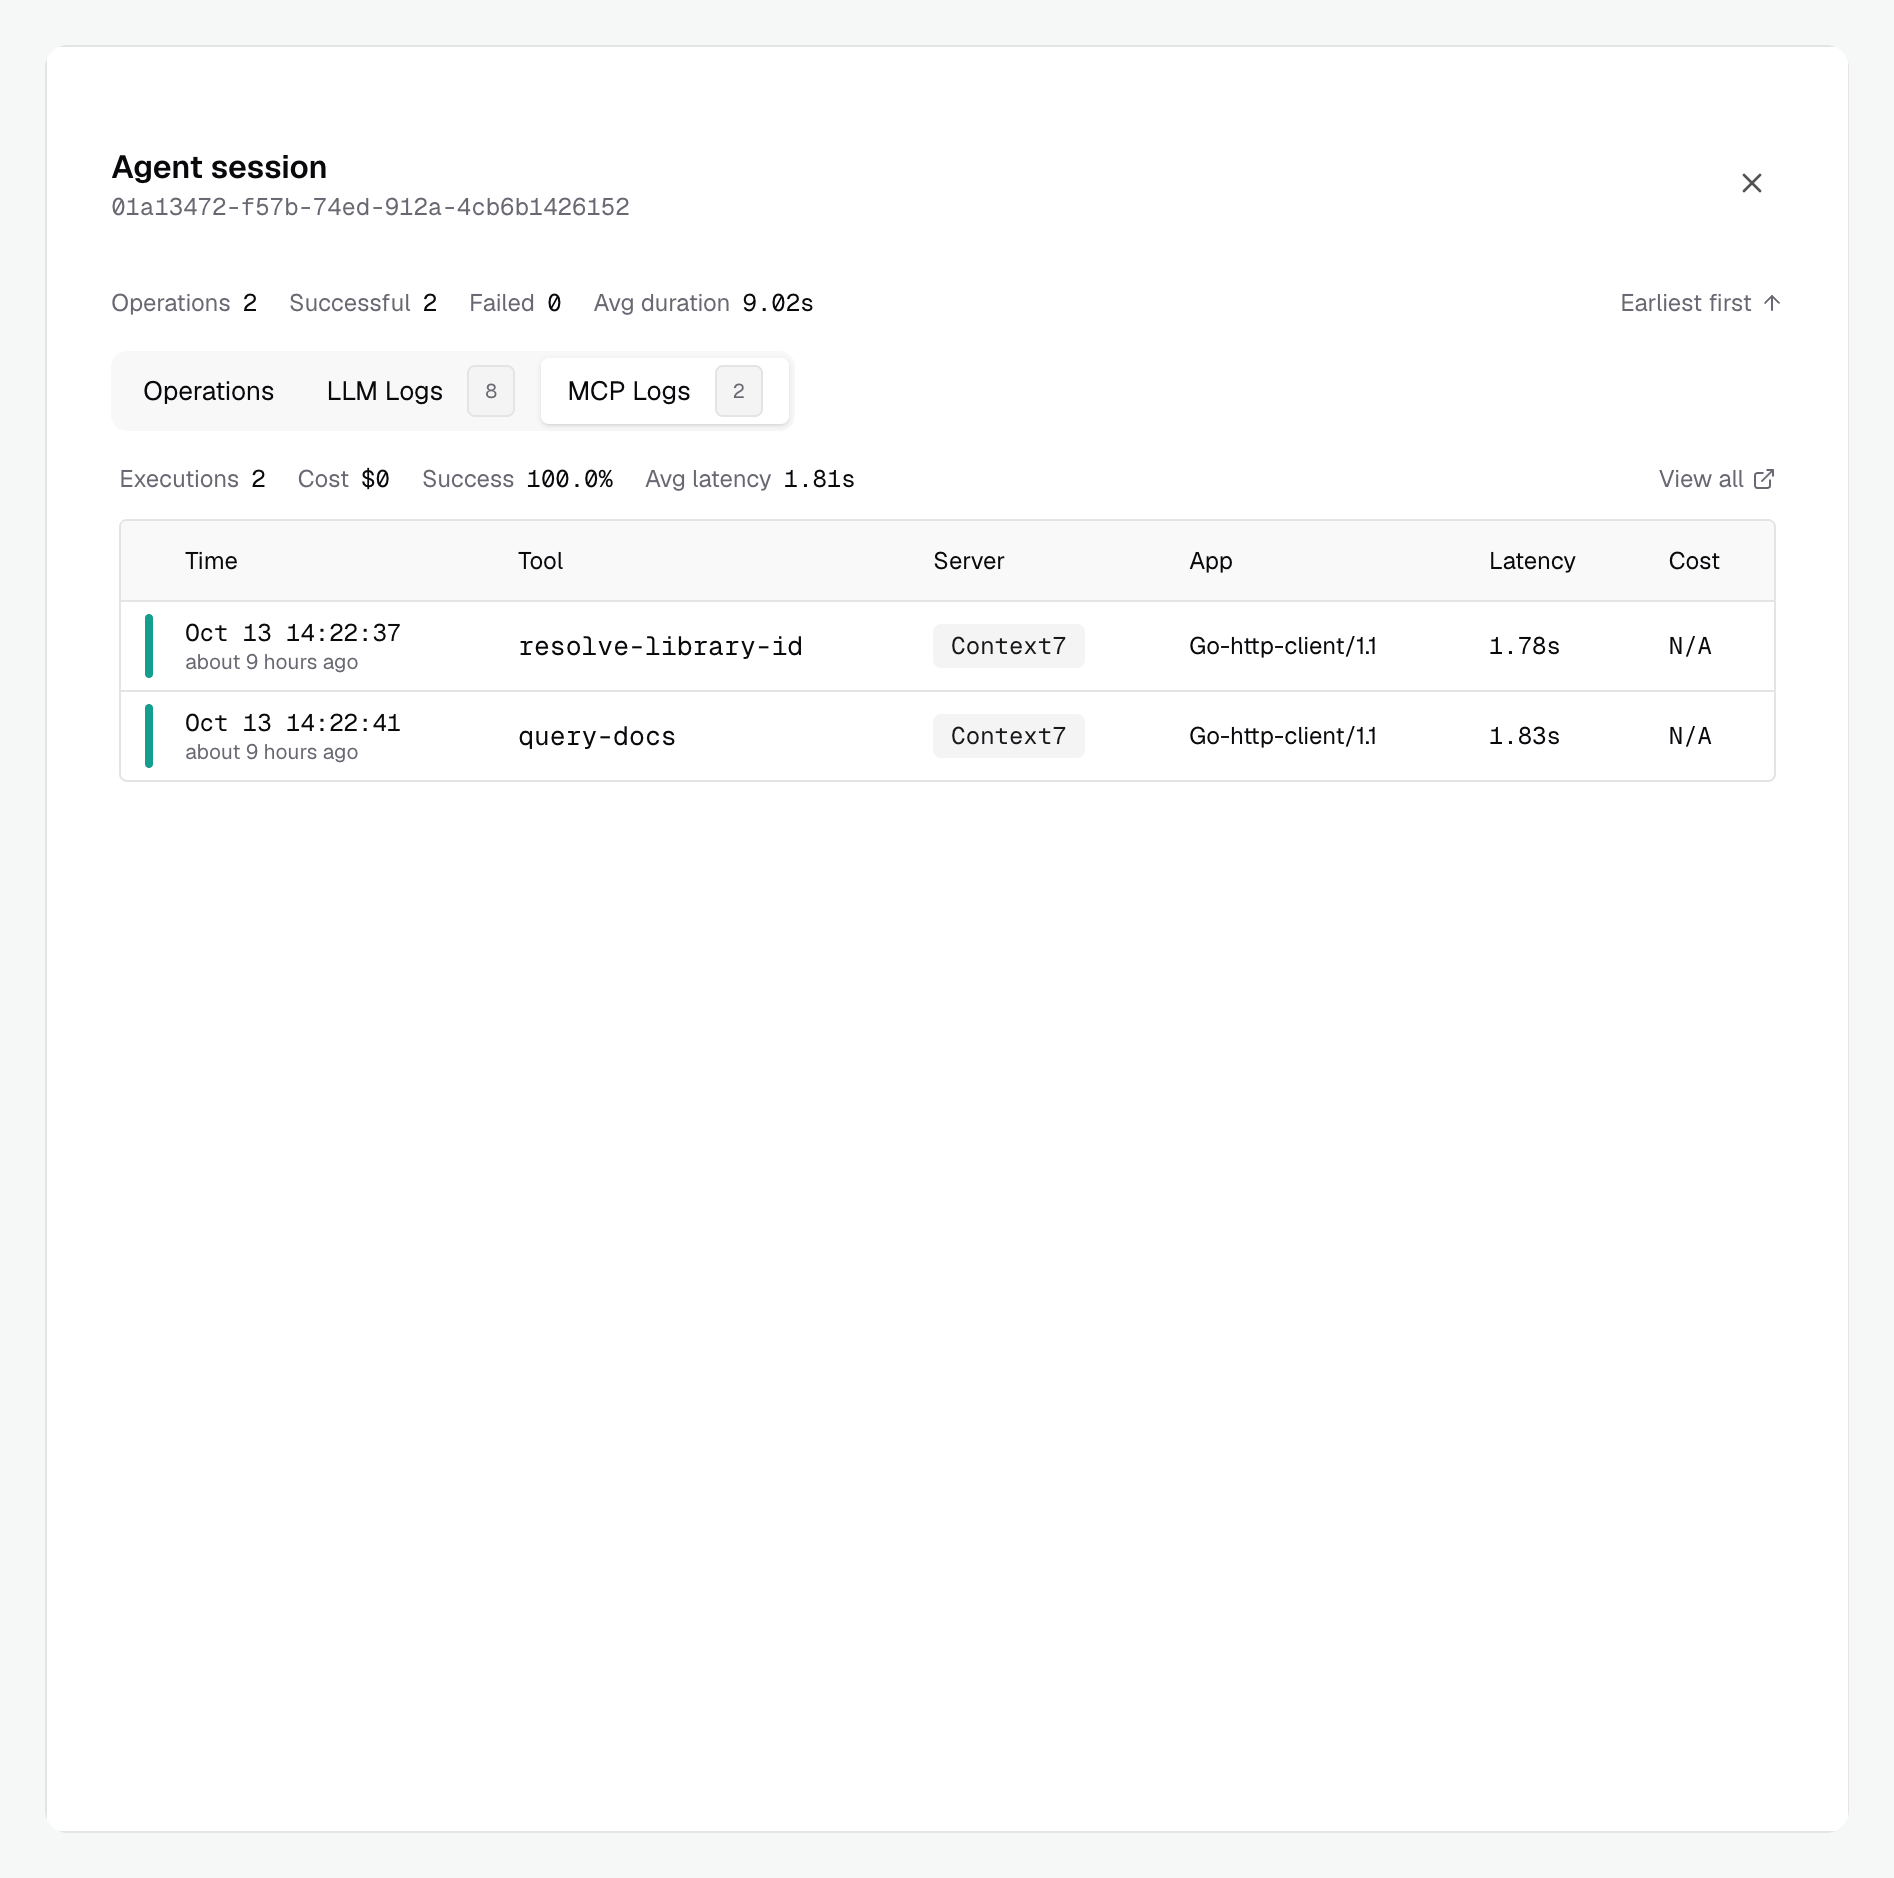
 We selected **MCP Logs** to see the session's two Context7 tool calls, which resolved the library and retrieved its documentation.
 ## Open an operation
The detail view shows the operation, gateway status, agent, transports, available IDs, task state, and timing. The available tabs depend on the operation and data it produced.
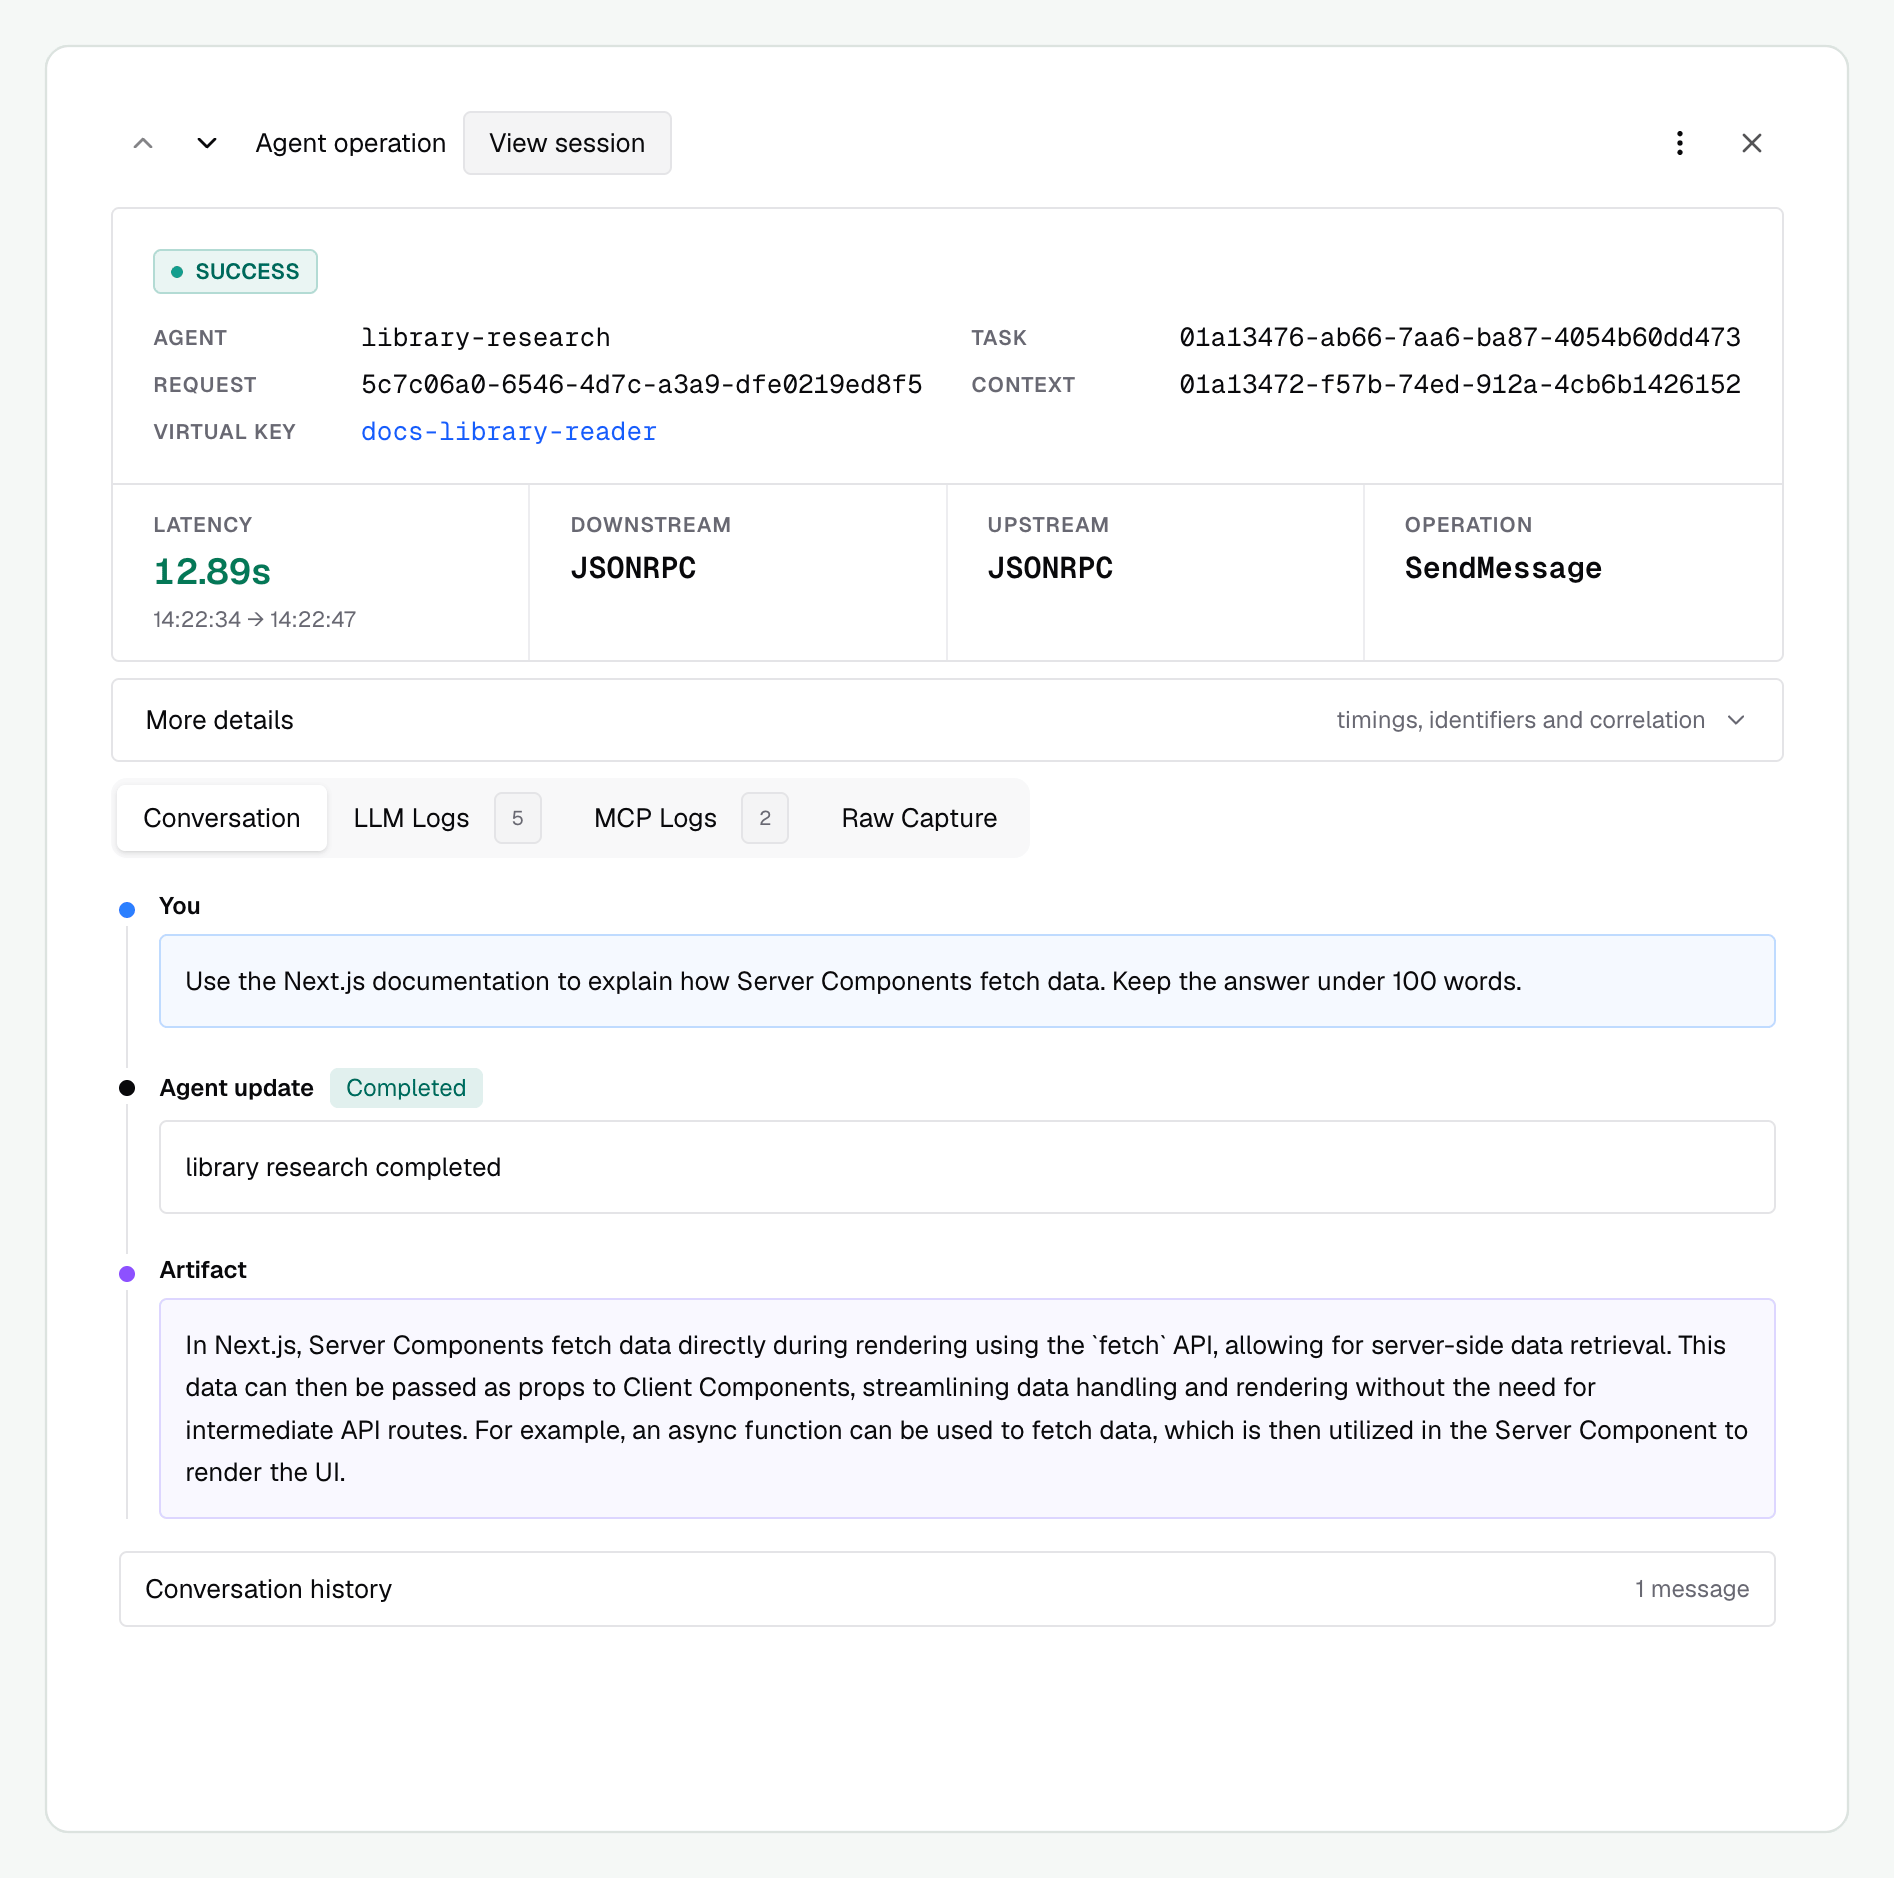
We opened our research agent's `SendMessage` operation. The summary shows its status, IDs, transports, and latency; **Conversation** shows the request, completed task, and returned artifact.
## Open an operation
The detail view shows the operation, gateway status, agent, transports, available IDs, task state, and timing. The available tabs depend on the operation and data it produced.
We opened our research agent's `SendMessage` operation. The summary shows its status, IDs, transports, and latency; **Conversation** shows the request, completed task, and returned artifact.
 | View | What to look for |
| - | - |
| Conversation | The message, returned task, status text, and artifacts. |
| Payload | Typed request or response details for non-conversation operations. |
| Events | Status and artifact updates associated with a stream or operation. |
| LLM Logs | Calls carrying this task ID as their agent correlation ID. |
| MCP Logs | Tool calls carrying this task ID as their agent correlation ID. |
| Raw Capture | Stored HTTP request and response bytes, when capture was enabled. |
An ID may be absent because the operation never had it. A card fetch has no task; an authentication failure may happen before the agent creates a context.
Agent operation timing measures the agent-facing work. Tokens and model cost belong to the correlated LLM logs; they are not separate token charges on the A2A operation itself.
### Inspect streaming work
Open a `SendStreamingMessage` or `SubscribeToTask` operation, then its **Events** tab. Events preserve their order and expose the available task, context, message, and artifact IDs.
Read task-state updates to follow progress. Read artifact updates to see output as it arrives. The final task state tells you whether work completed, failed, or needs input. A stream ending does not by itself mean the task completed.
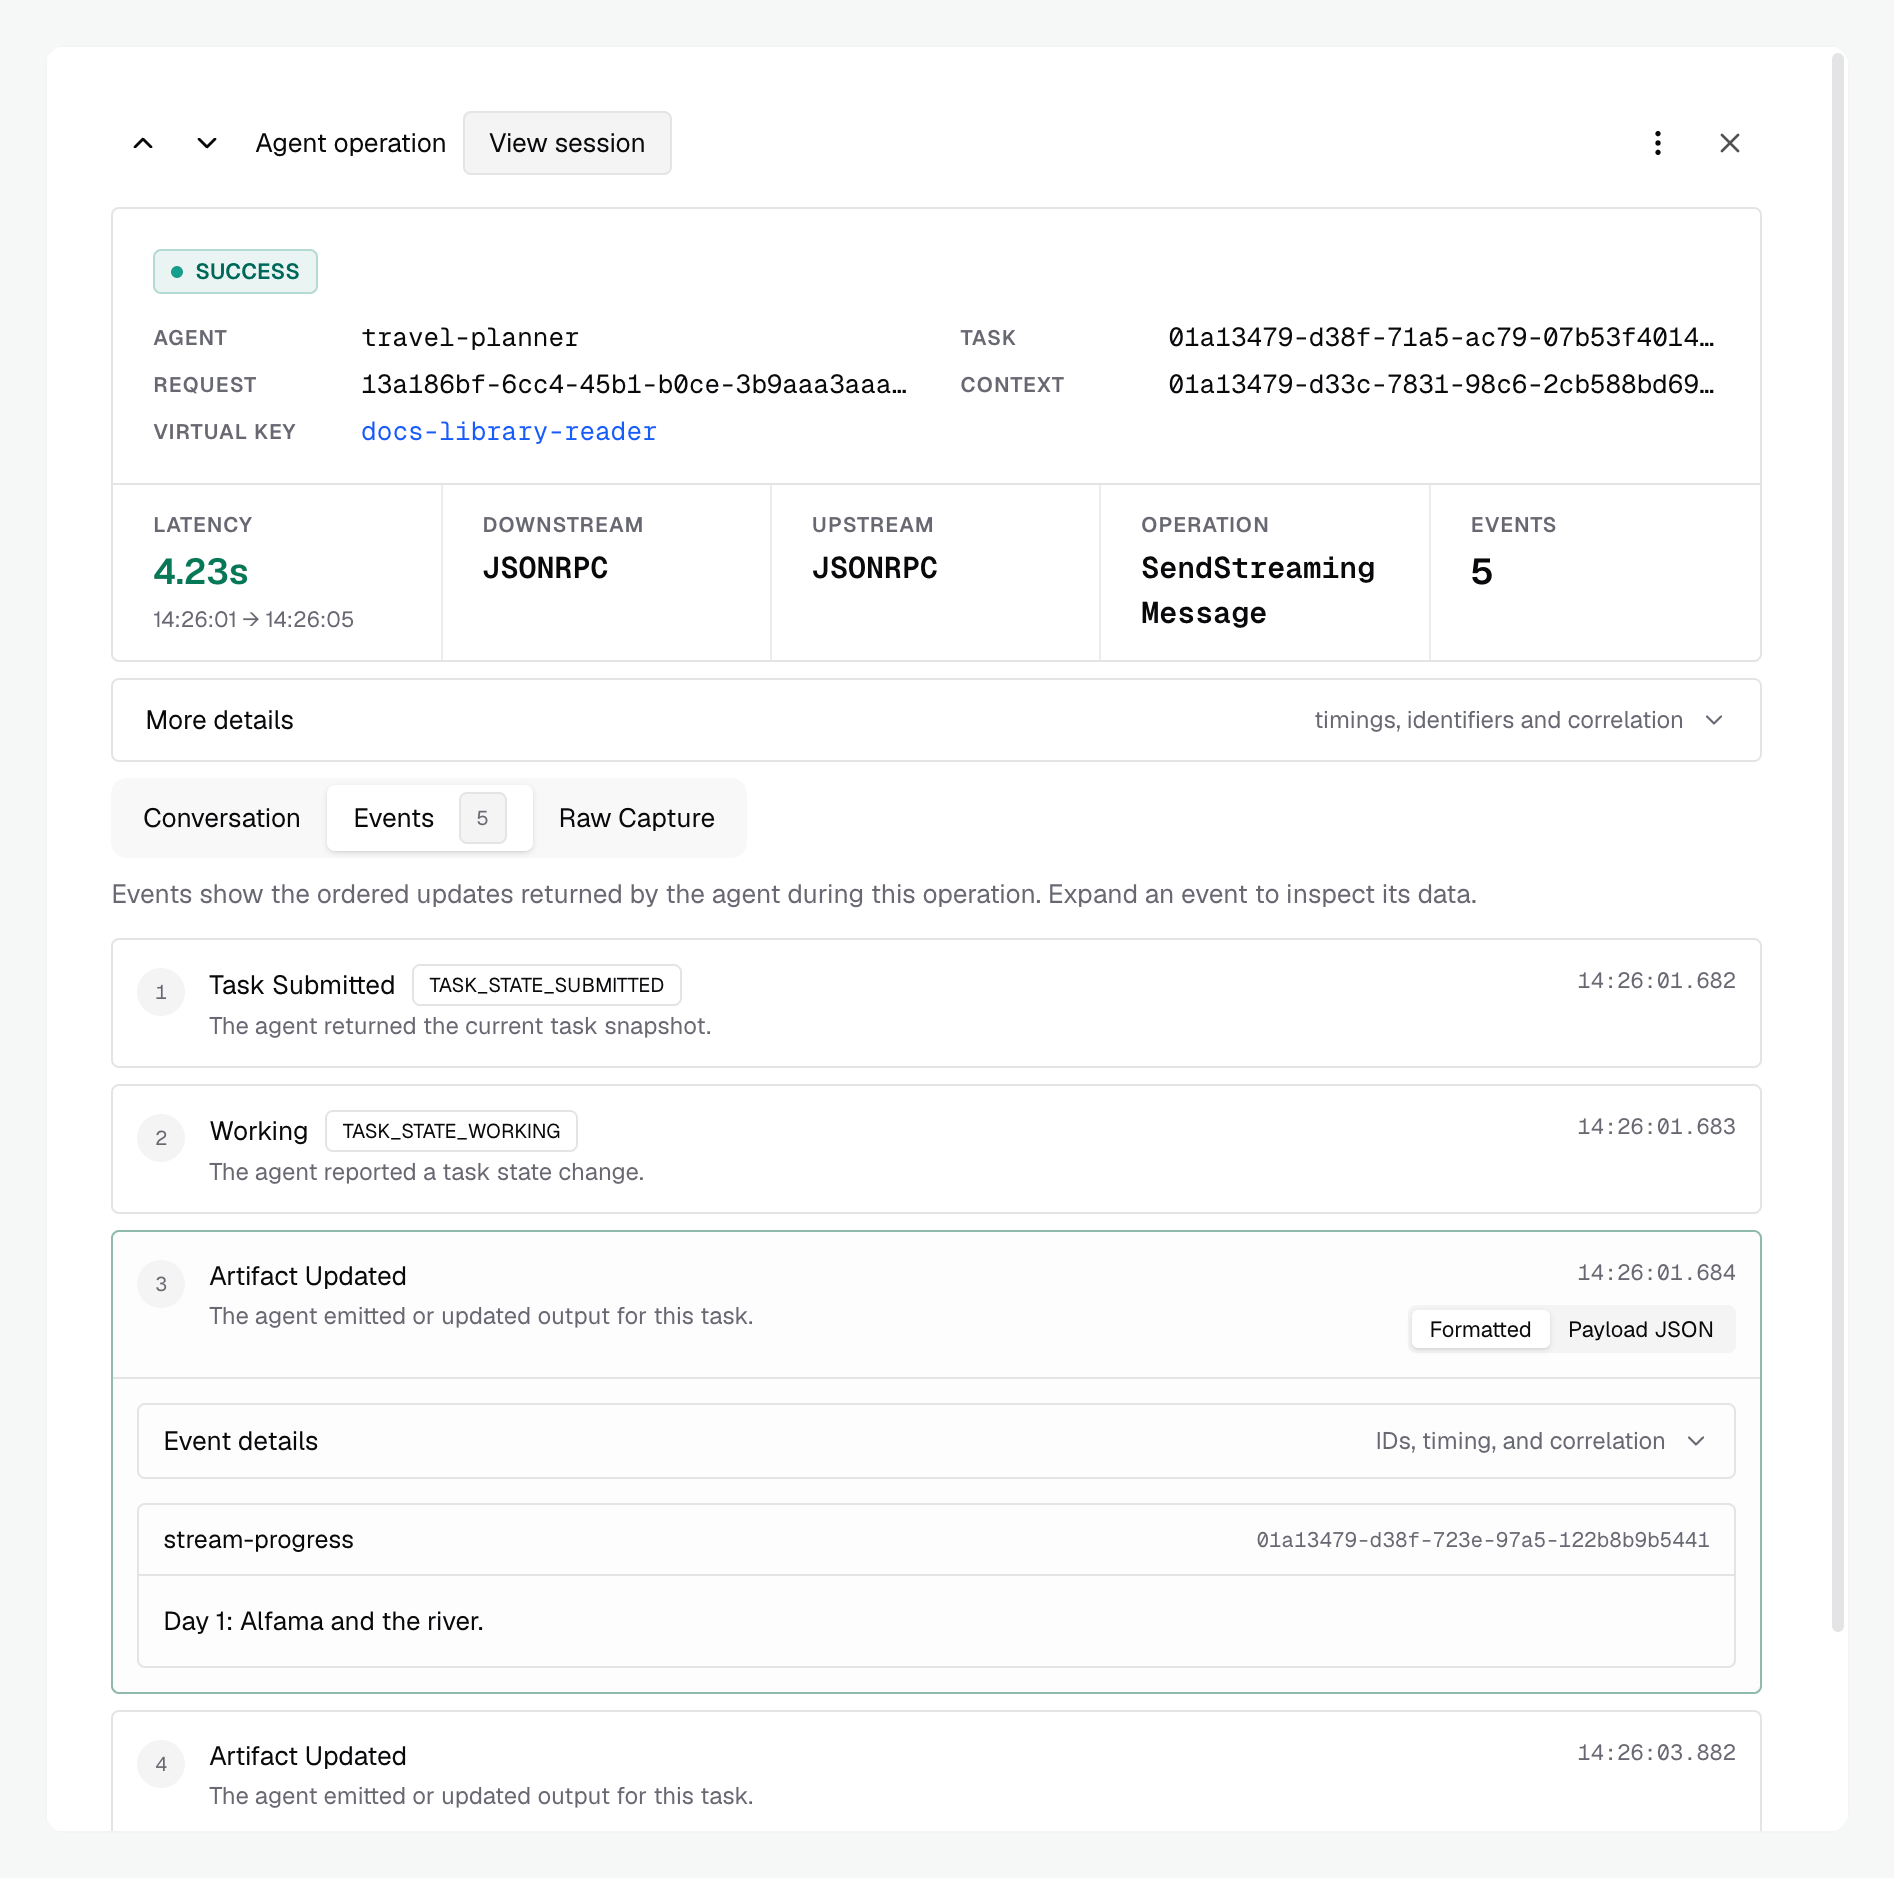
We opened our travel agent's `SendStreamingMessage` operation and selected **Events**. Its five updates show the initial task, progress, artifact output, and completion in order. The first **Artifact updated** event is expanded to show the itinerary text emitted during the stream.
| View | What to look for |
| - | - |
| Conversation | The message, returned task, status text, and artifacts. |
| Payload | Typed request or response details for non-conversation operations. |
| Events | Status and artifact updates associated with a stream or operation. |
| LLM Logs | Calls carrying this task ID as their agent correlation ID. |
| MCP Logs | Tool calls carrying this task ID as their agent correlation ID. |
| Raw Capture | Stored HTTP request and response bytes, when capture was enabled. |
An ID may be absent because the operation never had it. A card fetch has no task; an authentication failure may happen before the agent creates a context.
Agent operation timing measures the agent-facing work. Tokens and model cost belong to the correlated LLM logs; they are not separate token charges on the A2A operation itself.
### Inspect streaming work
Open a `SendStreamingMessage` or `SubscribeToTask` operation, then its **Events** tab. Events preserve their order and expose the available task, context, message, and artifact IDs.
Read task-state updates to follow progress. Read artifact updates to see output as it arrives. The final task state tells you whether work completed, failed, or needs input. A stream ending does not by itself mean the task completed.
We opened our travel agent's `SendStreamingMessage` operation and selected **Events**. Its five updates show the initial task, progress, artifact output, and completion in order. The first **Artifact updated** event is expanded to show the itinerary text emitted during the stream.
 ### Inspect files and metadata
In the conversation or event view, inspect the artifact name, description, and parts. A file part can contain inline bytes or an external URI. Supported files may have a preview or download action; the payload shows the filename, MIME type, URI, and metadata when you need the exact representation.
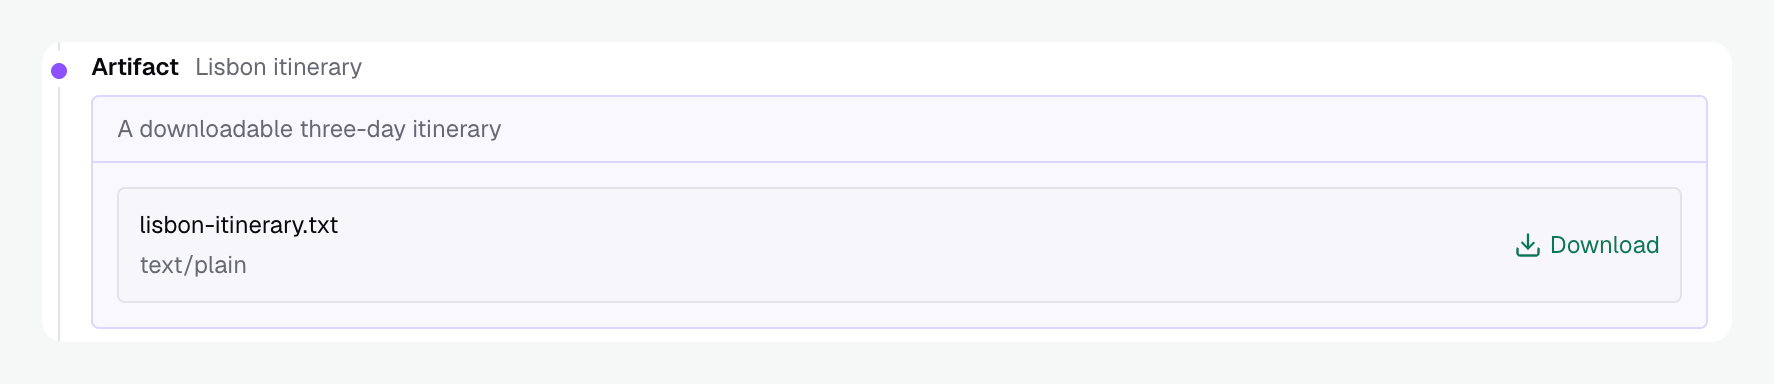
Our travel agent returned a **Lisbon itinerary** artifact with a description and a `text/plain` file named `lisbon-itinerary.txt`. Its **Download** action saves the file.
### Inspect files and metadata
In the conversation or event view, inspect the artifact name, description, and parts. A file part can contain inline bytes or an external URI. Supported files may have a preview or download action; the payload shows the filename, MIME type, URI, and metadata when you need the exact representation.
Our travel agent returned a **Lisbon itinerary** artifact with a description and a `text/plain` file named `lisbon-itinerary.txt`. Its **Download** action saves the file.
 ### Follow model and tool failures
For example, a research task fails while looking up documentation:
1. Open the failed task's agent operation and read its status message.
2. Open **MCP Logs** and inspect the matching tool call's input, output, and error.
3. Open **LLM Logs** to see whether the model requested the wrong tool or received an unusable result.
4. Return to the session to check whether a later message retried or continued the work.
A successful A2A response can contain a failed task. The operation's **Success** status describes the protocol response; read the returned task state in the conversation to see whether the agent's work succeeded. Where a row records a task state, the **Task state** filter helps narrow the results; a SendMessage request row may not record its returned task state in that filter field.
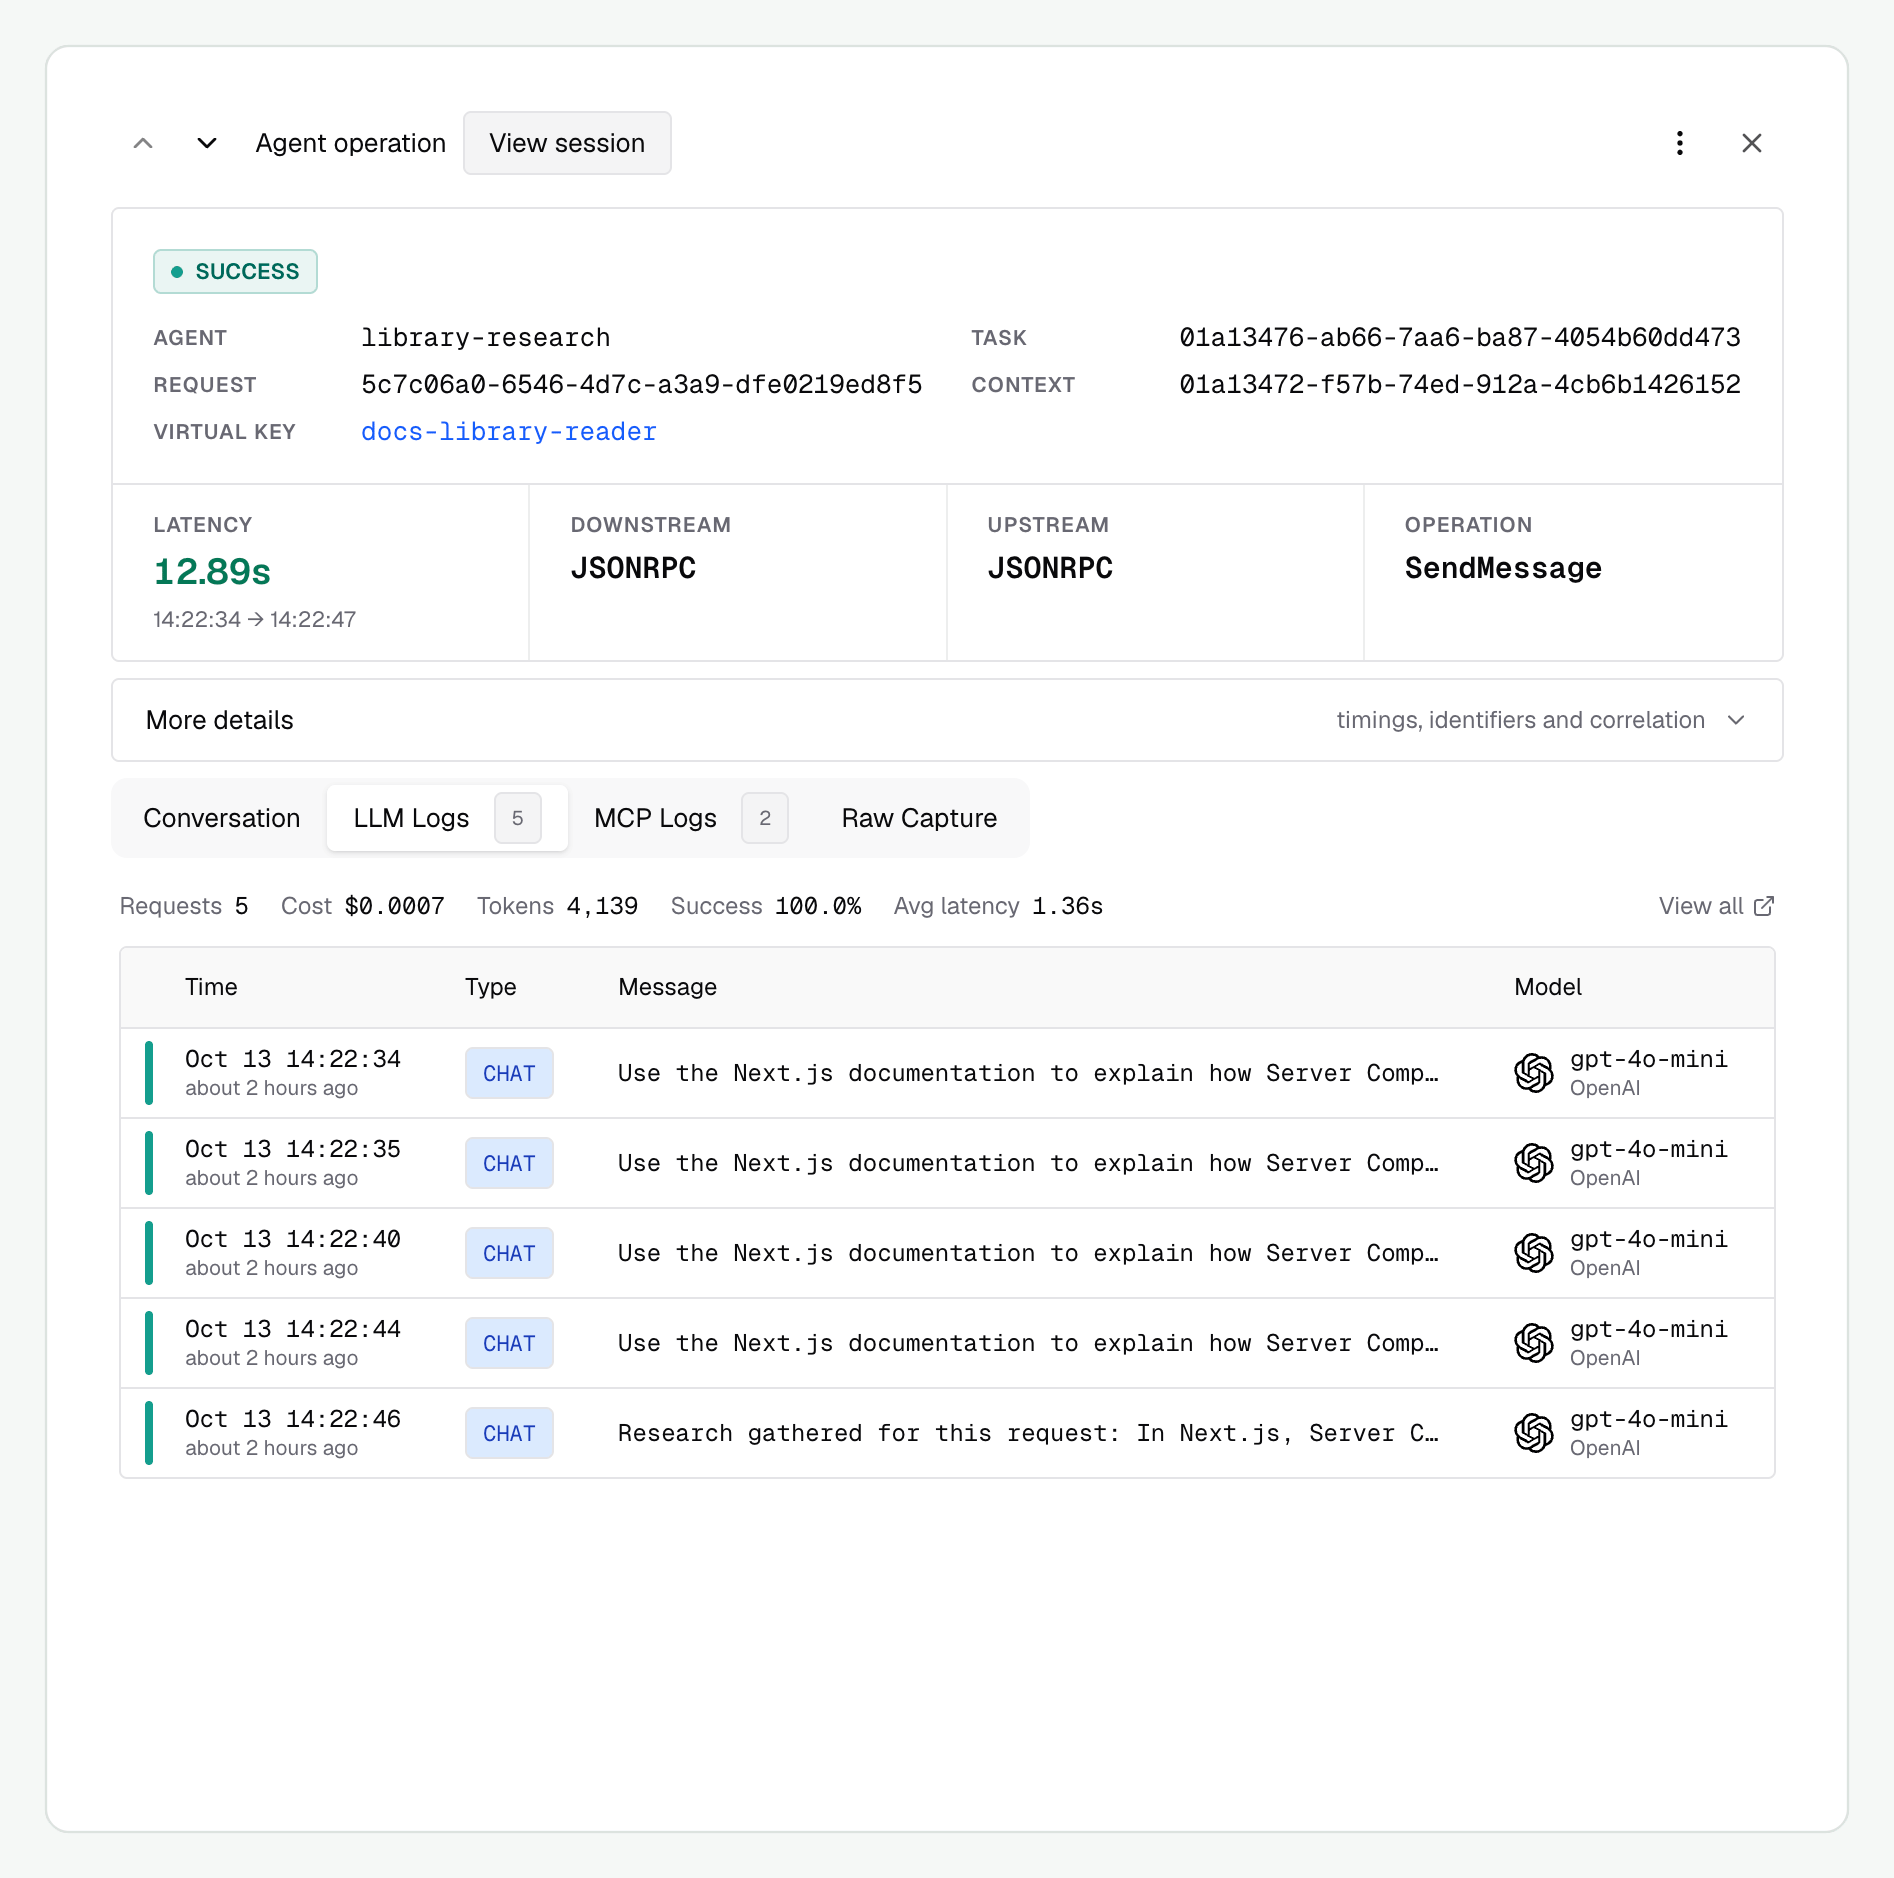
We selected **LLM Logs** on our research task's operation. The five model calls below carry that task's correlation ID.
### Follow model and tool failures
For example, a research task fails while looking up documentation:
1. Open the failed task's agent operation and read its status message.
2. Open **MCP Logs** and inspect the matching tool call's input, output, and error.
3. Open **LLM Logs** to see whether the model requested the wrong tool or received an unusable result.
4. Return to the session to check whether a later message retried or continued the work.
A successful A2A response can contain a failed task. The operation's **Success** status describes the protocol response; read the returned task state in the conversation to see whether the agent's work succeeded. Where a row records a task state, the **Task state** filter helps narrow the results; a SendMessage request row may not record its returned task state in that filter field.
We selected **LLM Logs** on our research task's operation. The five model calls below carry that task's correlation ID.
 We selected **MCP Logs** on the same operation. These two Context7 calls resolved the library and retrieved its documentation.
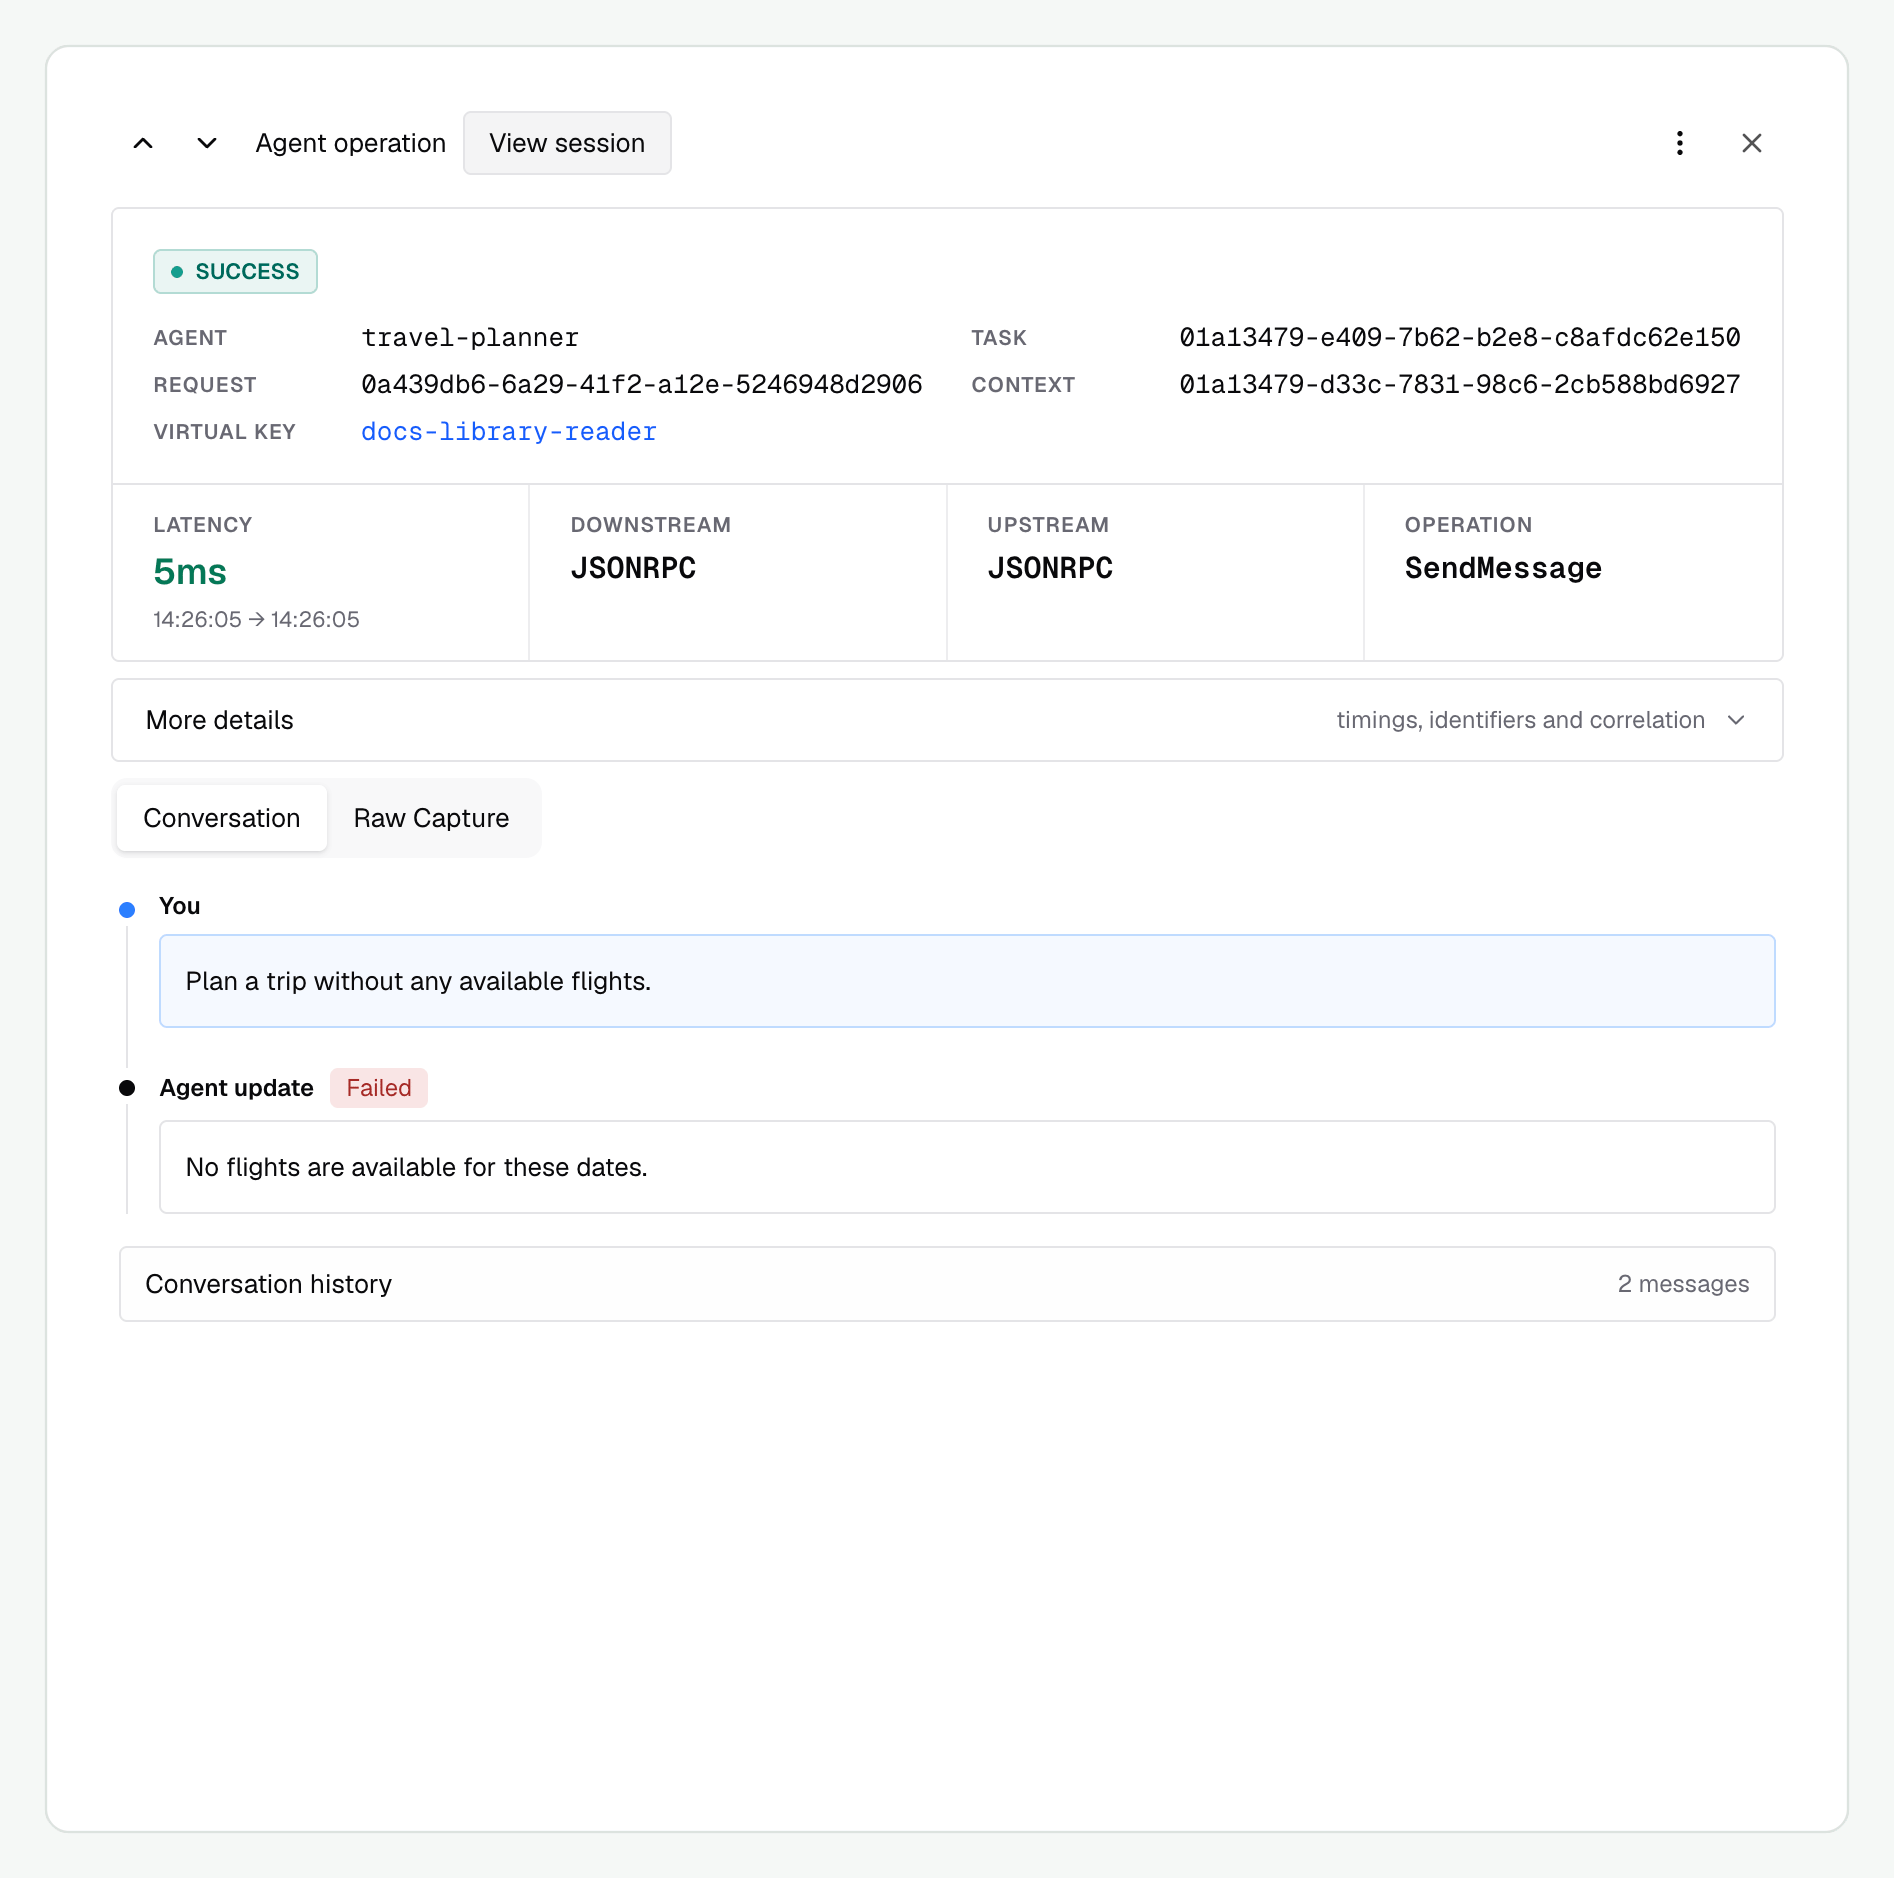
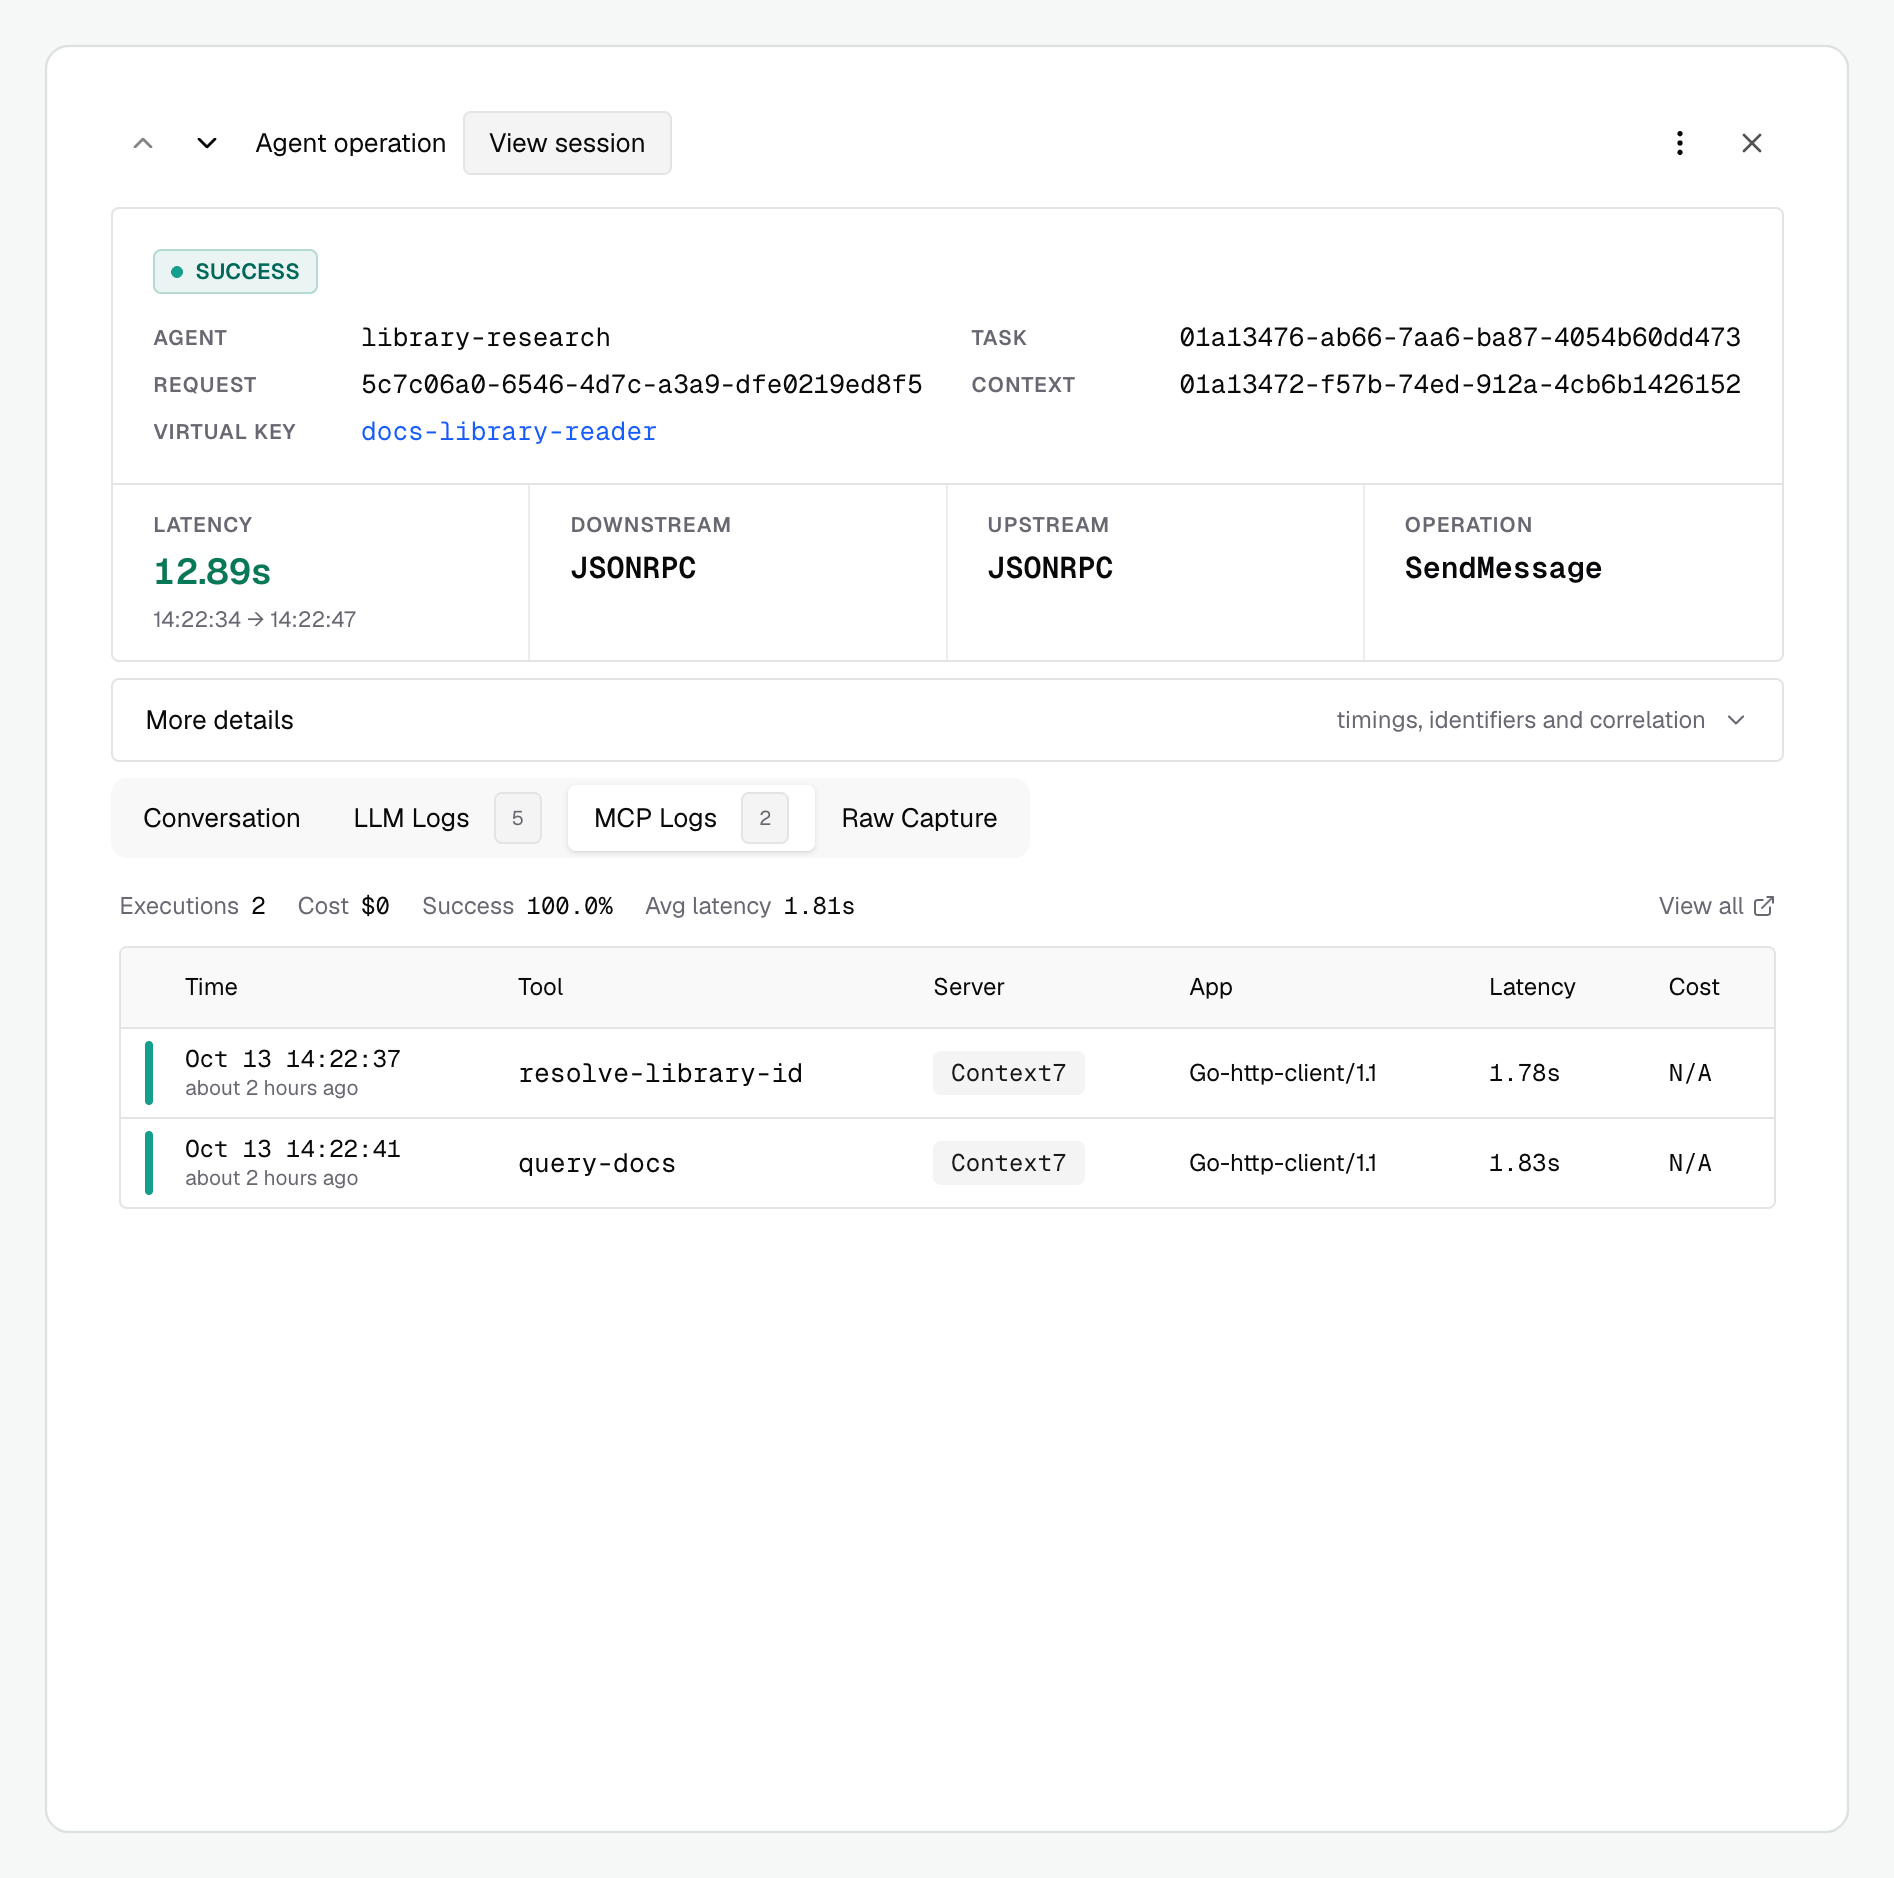 We asked our travel agent to plan a trip without available flights. The agent returned an HTTP 200 JSON-RPC response with the task in `result`, so the operation is logged as **Success**. The task itself reported `failed` because no flights were available.
 ## Filter model and tool logs by agent
In **LLM Logs** or **MCP Logs**, use **Agents** to find calls associated with a registered agent's conversations. This matches each call's session ID against context IDs recorded in Agent Logs for that agent and time window.
Use **Session ID** to follow one conversation, or **Agent correlation ID** to narrow to one A2A task. Enter the task ID itself for that correlation filter.
The Agents filter is conversation-based. If several agents share the same context ID, it can include their calls from that conversation. Calls without `x-bf-session-id` cannot join this filter, even if they have a task correlation header. The selected time window must include the corresponding Agent Logs too.
## Inspect raw capture
Raw capture is disabled by default. Enable it in **Agents → Agent Settings → Capture Raw Request and Response**, then make a fresh request. The [configuration guide](./configuration#capture-raw-http-payloads) covers config.json and Helm deployment options.
## Filter model and tool logs by agent
In **LLM Logs** or **MCP Logs**, use **Agents** to find calls associated with a registered agent's conversations. This matches each call's session ID against context IDs recorded in Agent Logs for that agent and time window.
Use **Session ID** to follow one conversation, or **Agent correlation ID** to narrow to one A2A task. Enter the task ID itself for that correlation filter.
The Agents filter is conversation-based. If several agents share the same context ID, it can include their calls from that conversation. Calls without `x-bf-session-id` cannot join this filter, even if they have a task correlation header. The selected time window must include the corresponding Agent Logs too.
## Inspect raw capture
Raw capture is disabled by default. Enable it in **Agents → Agent Settings → Capture Raw Request and Response**, then make a fresh request. The [configuration guide](./configuration#capture-raw-http-payloads) covers config.json and Helm deployment options.
 Raw capture is separate from the structured conversation and event views. You can still read those views without storing raw HTTP payloads, subject to content-logging settings.
When capture exists, use the display and download actions to inspect the stored transport payload. A streaming HTTP response can contain SSE framing rather than one JSON document. gRPC raw capture is unavailable; use its structured details instead.
We enabled raw capture before sending our research request, then opened its **Raw Capture** tab. The screenshot shows the stored request and response and their download links.
Raw capture is separate from the structured conversation and event views. You can still read those views without storing raw HTTP payloads, subject to content-logging settings.
When capture exists, use the display and download actions to inspect the stored transport payload. A streaming HTTP response can contain SSE framing rather than one JSON document. gRPC raw capture is unavailable; use its structured details instead.
We enabled raw capture before sending our research request, then opened its **Raw Capture** tab. The screenshot shows the stored request and response and their download links.
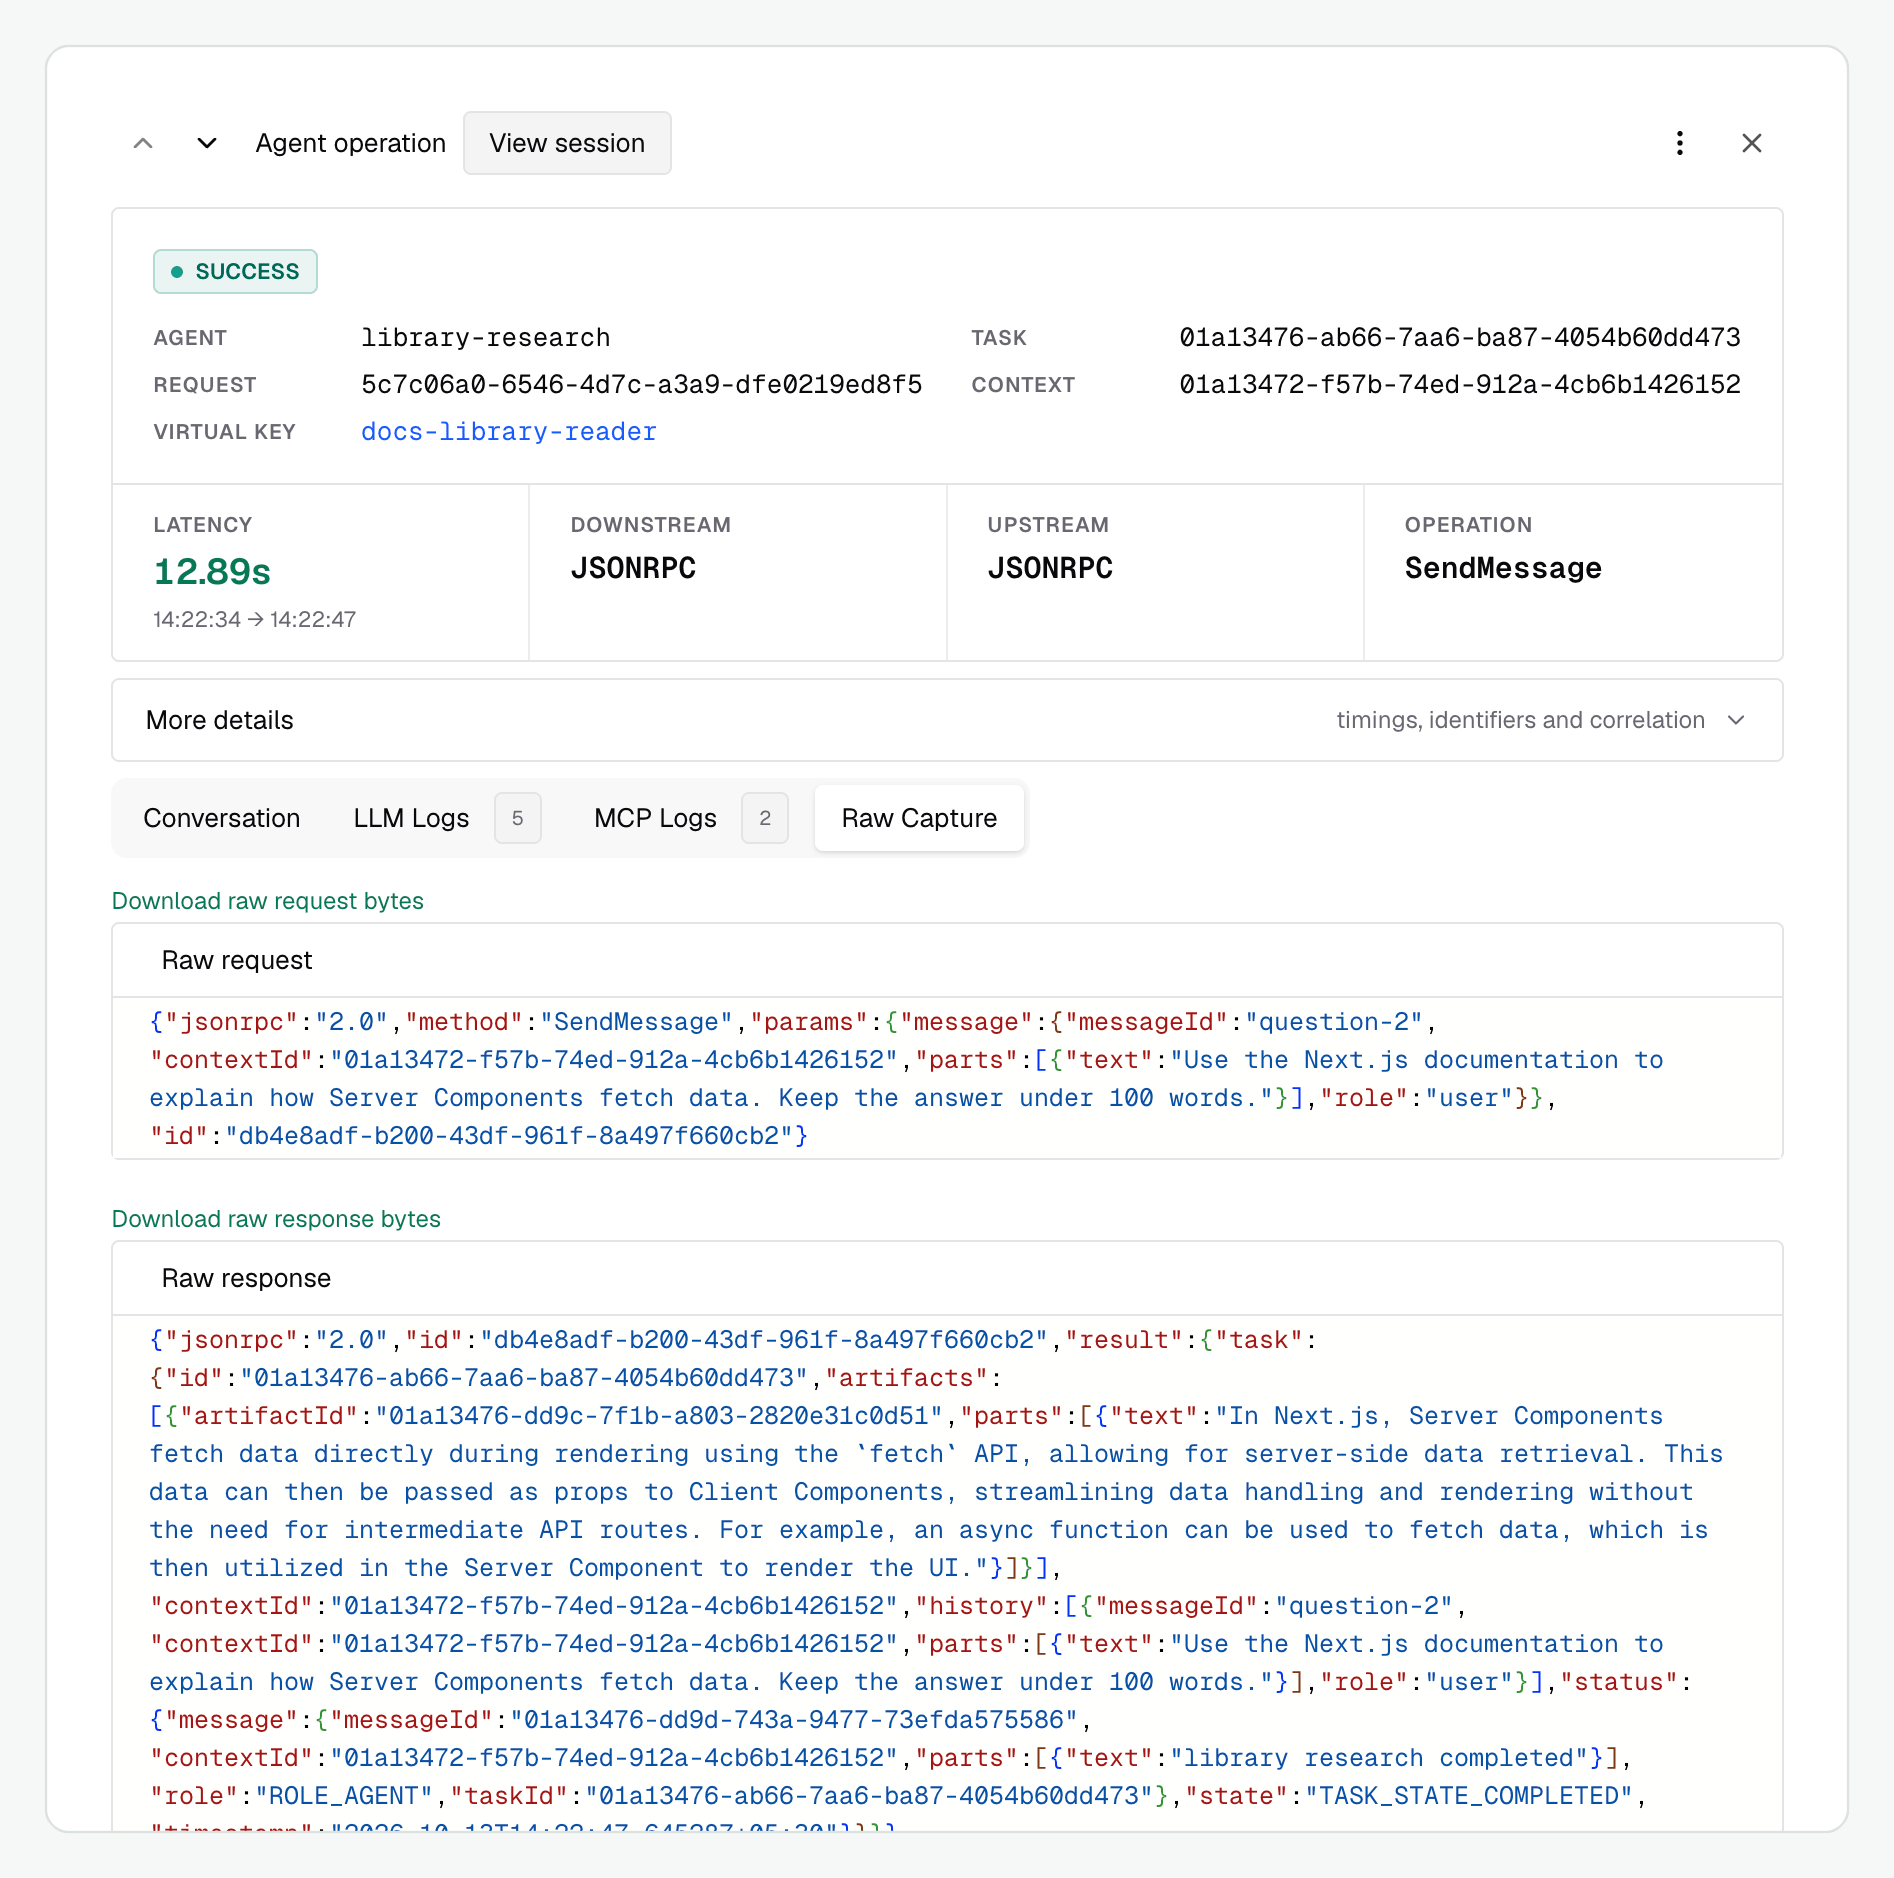 Capture is limited to 1 MiB in each direction. Oversized or incomplete bodies are omitted. A missing capture therefore does not mean the agent returned an empty response. Local push-config GET and LIST operations do not have an upstream HTTP exchange to capture.
Raw transport bytes can include sensitive content and are not guaranteed to be secret-redacted. Parsed history redacts credential fields. Enable raw capture only where your logging policy permits it.
## Understand timing
**Duration** is the operation's measured elapsed time. **Upstream latency** measures the agent-facing call. **Overhead** accounts for the remaining gateway work. Expand the overhead breakdown to see where that time went.
| Category | What it includes |
| - | - |
| Protocol library | A2A SDK request handling and protocol work. |
| Middleware | Authentication and request middleware. |
| Plugins | Governance, logging, and other enabled hooks. |
| Serialization | Parsing and encoding protocol payloads. |
| Processing | Gateway preparation and push configuration or delivery storage work. |
| Client delivery | Writing streamed output and waiting for a slow client. |
Protocol library time may account for a large share of a small operation's overhead. It is measured SDK handling time, not an LLM generation measurement. Push operations can have more processing time because they read or write durable configuration and delivery state. A local push-config lookup can therefore have overhead and no upstream latency.
Compare similar operations and transports. A long-lived stream and a single task lookup measure different work; their durations are not interchangeable benchmarks.
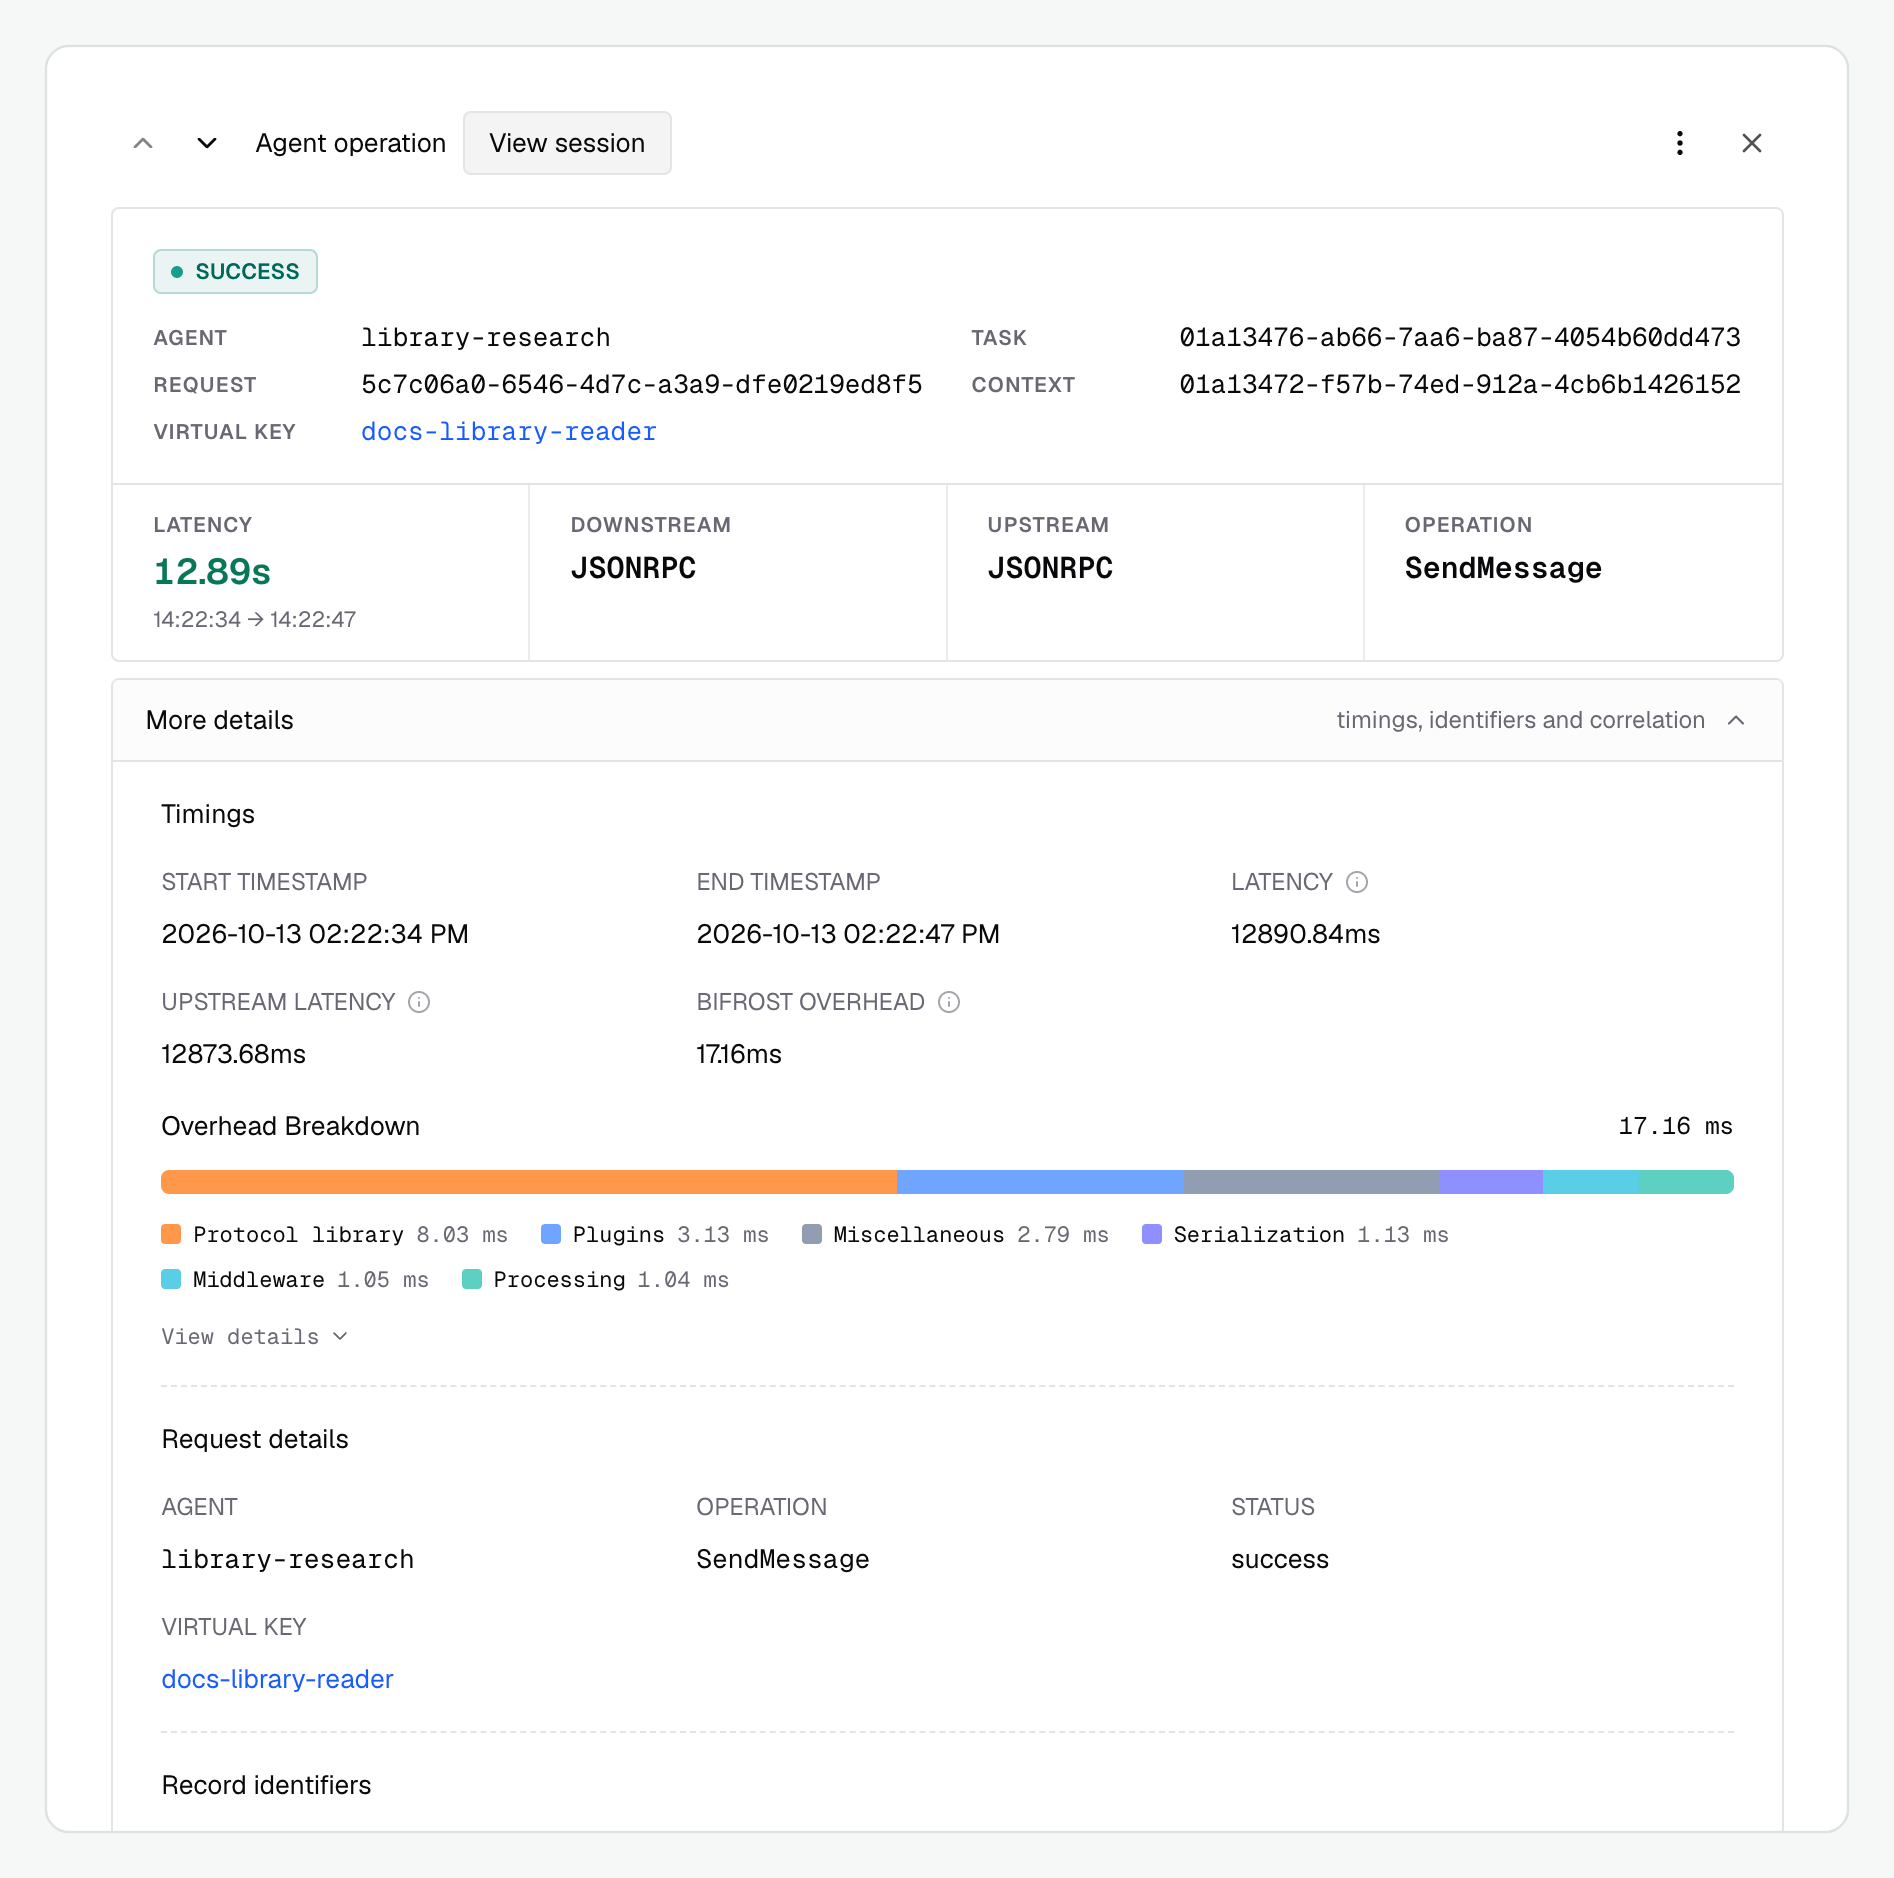
We expanded **More details** on our research operation to inspect its measured gateway overhead. The breakdown separates protocol handling from the other processing categories.
Capture is limited to 1 MiB in each direction. Oversized or incomplete bodies are omitted. A missing capture therefore does not mean the agent returned an empty response. Local push-config GET and LIST operations do not have an upstream HTTP exchange to capture.
Raw transport bytes can include sensitive content and are not guaranteed to be secret-redacted. Parsed history redacts credential fields. Enable raw capture only where your logging policy permits it.
## Understand timing
**Duration** is the operation's measured elapsed time. **Upstream latency** measures the agent-facing call. **Overhead** accounts for the remaining gateway work. Expand the overhead breakdown to see where that time went.
| Category | What it includes |
| - | - |
| Protocol library | A2A SDK request handling and protocol work. |
| Middleware | Authentication and request middleware. |
| Plugins | Governance, logging, and other enabled hooks. |
| Serialization | Parsing and encoding protocol payloads. |
| Processing | Gateway preparation and push configuration or delivery storage work. |
| Client delivery | Writing streamed output and waiting for a slow client. |
Protocol library time may account for a large share of a small operation's overhead. It is measured SDK handling time, not an LLM generation measurement. Push operations can have more processing time because they read or write durable configuration and delivery state. A local push-config lookup can therefore have overhead and no upstream latency.
Compare similar operations and transports. A long-lived stream and a single task lookup measure different work; their durations are not interchangeable benchmarks.
We expanded **More details** on our research operation to inspect its measured gateway overhead. The breakdown separates protocol handling from the other processing categories.
 Check that the agent sends both headers on its outgoing Bifrost requests:
```http theme={null}
x-bf-session-id:
x-bf-agent-correlation-id:
```
Task-level tabs match the task correlation ID. Session-level tabs match the context ID. Check the chosen time window, allow asynchronous log ingestion to settle, and confirm your account can read the related LLM or MCP logs. Calls sent directly to a provider or MCP server do not appear as Bifrost calls.
Next, review [Gateway settings and transports](./configuration) for deployment options. If a request is failing, jump to [Troubleshooting](./troubleshooting).
This documentation is built and hosted on [Mintlify](https://mintlify.com), a developer documentation platform.
Check that the agent sends both headers on its outgoing Bifrost requests:
```http theme={null}
x-bf-session-id:
x-bf-agent-correlation-id:
```
Task-level tabs match the task correlation ID. Session-level tabs match the context ID. Check the chosen time window, allow asynchronous log ingestion to settle, and confirm your account can read the related LLM or MCP logs. Calls sent directly to a provider or MCP server do not appear as Bifrost calls.
Next, review [Gateway settings and transports](./configuration) for deployment options. If a request is failing, jump to [Troubleshooting](./troubleshooting).
This documentation is built and hosted on [Mintlify](https://mintlify.com), a developer documentation platform.